BenQ XL2420T
Specifications
| Brand: | BenQ |
|---|---|
| Model: | XL2420T |
| Size: | 24" |
| Resolution: | 1920x1080 |
| Panel type: | TN |
| Max. refresh rate: | 144 Hz |
| Panel: | AUO M240HW01 V8 |
| Processor: | MST 8556T (MSTAR) |
| Backlight type: | LED (white, edge) |
| LED driver: | OZ9905GN (o2micro) |
| TachistoMode: | wake-up |
| Price (approx.): | USD 400 |
| Monitor release date: | 2012-01 |
| This review's date: | 2013-04 |

Reviews
BenQ XL2420T review on PC monitors.
Benq XL2420T review on TFT central.
Comparison with other LCDs
The BenQ XL2420T has a successor, the BenQ XL2411T, which used to provide higher refresh rates. However, meanwhile (since late 2013), these monitors both provide a maximal refresh rate of 144 Hz and, in addition, flicker-free backlight. Nevertheless, the measurements presented here still refer to the first version (i.e., 120 Hz, PWM backlight, 2msGTG).
ATTENTION: Notice that there is some confusion about the model names. In North America it is still the old version which is sold as XL2420T, whereas the new version is sold as XL2420TE!
See also Measuring color resolution for a comparison between the EIZO FORIS FG2421 and the BenQ XL2420T regarding the round-off errors provoked by the pixel processing (gamma table look-up etc.). Figure 1 gives a summary of the measurements revealing that the BenQ is superior in this respect.
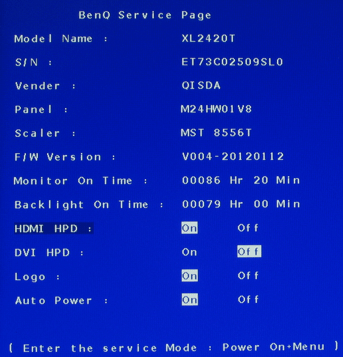
Have the monitor connected to a valid signal source. The service menu can be entered by keeping the 4th touch sensitive button from the top, which normally is the "menu" button, touched while powering on the monitor. Once all the touch buttons light up, release the touch button and wait until you see the normal desktop screen coming up. Then touch the "menu" button again, which will bring up the service menu. The "menu" button will react normal again after the next power-on.
Note that the service menu lists a M24HW01-V8 panel, whereas the sticker on the panel itself says M240HW01-V8.


LCD reaction time
The luminance curves in Figure 2 and Figure 3 show how fast the LCD reacts on changes of pixel values at a refresh rate of 100 Hz, without and with overdrive. Each figure shows three pixel value step sizes – maximal (blue), intermediate (red), and small (green). All curves are normalized so as to allow easier comparison of the timings. The monitor has two AMA settings (overdrive) – ON and OFF –, which clearly make a difference here. When overdrive is active, the overshoot seems to be quite strong, but one could argue that it is the average luminance during each refresh interval that matters (or the accumulated luminous energy) and, thus, that the overshoot is needed to compensate for the slow rise and fall times, at least for the first refresh interval directly after a change.
Note that the monitor was reset to its factory settings and the Picture Mode was then set to Standard (factory setting is FPS1). The Contrast setting was at 50%, which is about the maximal setting that does not cause high pixel values to be cut off (white saturation). The 0%–100% curves look different when the Picture mode is set to FPS1 (not shown here). The maximum steady-state luminance is reduced then, which leaves enough room for overdrive to be effective even at the highest pixel values (i.e., at 100%). However, the momentary luminance overshoot never goes beyond what can be observed when Picture mode is set to Standard.
The measurements have been taken with the photo diode PDA36A (Thorlabs), whose gain was set to maximum (70 dB) as bandwidth limitation was not of concern here (bandwidth is getting smaller as gain is increased).
Only a horizontal bar covering the upper 10% of the screen was flickered, which is important as the number of effective lines determines how much the measurement is affected by the low-pass filtering being induced by the sequential updating of the LC pixel cells from the top of the screen to the bottom.
External LED backlight control
Under certain conditions this monitor is suitable for tachistoscope applications. The LED driver does not fully maintain the supply voltage level when the LED are switched off. However, the voltage level decreases relatively slowly over time and is quickly reestablished without major artifacts as soon as the backlight is switched on again. In applications where the induced errors cannot be tolerated, a brief wake-up pulse can be issued while "presenting" a black image, shortly before the actual stimulus image is going to be presented.

LED switching characteristics
The measurements shown here are about the accuracy of luminous pulse energies and were taken with an experimental scenario in mind where one stimulus (pulse) is presented in each trial and a subject has to give a response, thereby inducing some variation of the inter-stimulus interval according to the variation in response times. The stimulus interval has been randomly varied between 0.5 s and 5 s, uniformly distributed over a logarithmic time scale. Two different delays between the wake-up and stimulus pulse have been tested, 80 ms and 800 ms. These values were chosen with two scenarios in mind.
- The wake-up pulse is issued shortly before the stimulus. Because the wake-up pulse must not be visible to the observer, a black image has to be "presented" during the wake-up pulse. Thereafter, the software needs to switch to the stimulus image and the LCD has to settle to this new image, before the backlight can be finally switched on again for the stimulus pulse. The minimally required stimulus delay is mainly determined by the LCD reaction time (see figures above).
- The wake-up pulse is issued well before the stimulus presentation, for example, during the inter-trial pause. This implies a longer delay between the wake-up and the stimulus pulse.
Figure 4 shows what happens if no wake-up pulse is used at all. Note that the error variability is basically caused by the inter-stimulus interval variability, which was rather huge as compared to real-life response time variabilities. On the other hand, the average of the inter-stimulus intervals was just around 1.5 s (note that the inter-stimulus intervals were randomized on a log-scale). So it is pretty difficult to tell how large the errors were if the inter-stimulus interval variability were smaller. Anyway, Figure 5 shows the errors when applying wake-up pulses. The error variability for a 2 ms wake-up pulse is not as small and consistent as for longer wake-up pulses, indicating that 2 ms is just too short to wake the LED driver reliably. Although the error variability is smaller for longer wake-up pulses, the error curves still show some dependency over the wake-up pulse duration. Moreover, the error pattern looks quite different to that of other monitors, like, for example, the BenQ XL2411T or the Fujitsu P23T-6_IPS. Nevertheless, the maximal errors (i.e., over all stimulus pulse widths) are relatively small, especially if compared to the BenQ XL2411T.

The relative errors shown in these figures are given with respect to pulse energies that have been calculated as the product of the measured trigger pulse width and the steady-state luminance. Thus, the curves are free of errors which might have been caused by inaccuracies in the trigger signal generation.
The measurements have been taken with the photo diode PDA36A (Thorlabs), whose gain was set to 30 dB resulting in a bandwidth of 785 kHz. A Matlab program controlled the backlight through the parallel port, recorded trial-wise the signals (backlight trigger and photo diode output) with the PC oscilloscope PicoScope 4224 (Pico Technology), and analyzed the recordings after each trial.
| rising (on) | falling (off) | |
|---|---|---|
| Delay [µs] | 1.4 (SD=±0.029) | 1.7 (SD=±0.058) |
| Slope [µs] | 3.1 (SD=±0.273) | 2.9 (SD=±0.065) |
LED backlight switching times as measured from the rising and falling edges of the luminance curve when switching the backlight on and off. Shown are the average values with standard deviations. The delay is the time it takes for the luminance to change by 10% after the according trigger signal edge occurred. The slope is the time it takes for the luminance to rise from 10% to 90% (or fall from 90% to 10%, respectively).
The table contains switching delay and speed values, averaged over all presentations which employed a 10 ms wake-up pulse, an 80 ms delay, and a trigger pulse longer than 1 ms.

Making the backlight signals available
Note that opening this monitor is somewhat tricky, because the touch-sensitive buttons are tightly fixed to the bezel but are also connected to the controller board via a fragile cable. It is important to remove the rear-cover while leaving the front-bezel in place. Therefore, once the bezel is loosened, put the monitor, front down, on the table and swing open the rear-cover towards the side where the audio jack and the USB ports are located. In order to fully remove the rear-cover, unplug the respective cable from the main controller board.

