Acer XN253Q X: Difference between revisions
m (→Color spectra) |
(No difference)
|
Latest revision as of 08:04, 7 September 2022

Specifications
| Brand: | Acer |
|---|---|
| Model: | (Predator) XN253Q X |
| Size: | 24.5" |
| Resolution: | 1920x1080 |
| Panel type: | TN |
| Max. refresh rate: | 240 Hz |
| Panel: | AUO M250HTN01.9 |
| Backlight type: | LED (white, edge) |
| Price (approx.): | USD 500 |
| Monitor release date: | 2019-08 |
| This review's date: | 2020-04 |
Reviews
Acer XN253Q X review on PC monitors.
At a glance
This monitor uses a 2nd generation 240 Hz TN panel, which is supposed to be quicker than its 1st generation equivalent (which is used, for example, in the BenQ XL2540). The panel still just provides a low 6bit+FRC (=8bit) color resolution, which, unfortunately, is common for TN panels. The monitor is advertised as a gaming monitor and supports NVIDIA's G-Sync (not tested here). It can be connected via HDMI (v1.4) or DisplayPort (v1.2), but not via DVI. It comes with internal speakers and a USB 3.0 hub. The monitor stand is all metal and sturdier than it looks. Three sides of the screen are frame-less, meaning none of the edges of the panel, except for the bottom one, are covered by the bezel. However the active pixel area does not reach to the very edge of the panel, so there is more black around the active pixel area than just the 1 mm thin frame structure surrounding the panel.
Besides the usual standard settings, the OSD menu also has settings for saturation and 6-axis color calibration. This is of little use though, because bright shades of the primary colors are getting crushed when saturation is increased. When leaving the saturation settings at default, this monitor has a better sRGB coverage than, for example, the BenQ XL2540 (97.2% vs. 93.8%), but color accuracy is somewhat worse (dE2000=0.53 vs. 0.42), which is due to more digital noise in the color processing. So far, this is nothing out of the ordinary for a monitor with a TN panel. Much worse is actually the luminance inhomogeneity across the screen, which looks like being an issue with the anti-glare coating rather than the backlight. This might be specific to the tested sample though, because the BenQ XL2540, which should be very comparable regarding backlight and AG coating, does not show such issue, at least not to such an extent.
During the tests, this monitor appeared to be very picky regarding the video signal timing. This cannot necessarily be held against the monitor, because the user is not supposed to play around with the video timing anyway, but even with the standard timing, the monitor was sometimes rendering the content with one or two missing vertical pixel columns in the center of the screen when the refresh rate was changed. Even though this could be fixed by power-cycling the monitor, it indicates that this monitor might not be the most robust when it comes to video signal timing and/or video signal conditioning. Speaking of timing, this monitor has a slightly higher input lag than, for example, the BenQ XL2540.
Nevertheless, when putting all this aside and going just by the pixel settling performance, this monitor appears to be the best reviewed so far on this website. Of course, such comparisons always depend on which numbers they are exactly based on. The good performance is not only owed to the 2nd generation panel, which was expected to be a bit faster, but also to the overdrive circuit being very well adjusted, at least when using a 120 Hz refresh rate.
Saturation

When it comes to color accuracy, one potential problem are interactions between the primary color channels (Red, Green, Blue). If everything was perfectly accurate, the luminances of the primary colors would add up like LW=LR+LG+LB(=LRGB for short). However, in case it is not so perfect, the (normalized) error Δe=(LRGB−LW) / LRGB is different from zero, and we can use this error as a (rather crude) measure for saturation (see Figure 1). Note that this measure includes de-saturation effects caused by background luminance, which become overly dominant for dark shades, which is why these are excluded from the graphs shown in Figure 1. When compared to the BenQ XL2540, which has the equivalent 1st generation panel, the Acer looks less balanced. On the other hand, the Acer XN253Q X shows smaller errors for mid-range shades, which might be more important than showing small errors for dark shades.
Settings for saturation and 6-axis color
The Acer XN253Q X offers settings for adjusting saturation and even for a 6-axis color calibration, via the OSD menu. The 6-axis color calibration settings are basically just more fine-grained saturation settings, which allow different saturation adjustments for 6 different color axes. Saturation settings can help alleviating the de-saturation effects that are caused by, for example, color channel cross-talk or background luminance. Unfortunately, however, Acer's saturation calculations work in a way that crushes bright shades of some colors. This means, for example, that if saturation is increased, purely red pixels with pixel values greater than say 90% will all be presented as if they were at 100%. Reducing the Contrast or the RGB gains in order to provide more headroom for realizing higher saturation levels does not fix this problem, which makes the saturation settings rather useless. They work fine for reducing saturation, but this is rarely useful either.
Color processing noise
Ideally, the monitor does process incoming pixel values so that the according output luminance follows a smooth transfer function. This processing usually takes place in the digital domain, while aiming for some favorable Gamma characteristic and taking the over-all Contrast setting, per-channel gain settings, and also spatial or spatio-temporal dithering into account. One way of quantifying how consistently this is done for all pixel values, without needing to know the targeted Gamma characteristic, is to measure deviations from a smooth transfer function. Here, we do not focus on how well the transfer function is described by a simple Gamma function, but on how well the measured data points can be described by any reasonable smooth transfer function. We only measure the Green channel, because it is the brightest of the 3 color channels and, thus, provides the best signal-to-noise ratio. We set the Contrast and the Green gain to some values different from the factory settings in order to provoke potentially more internal calculations on the pixel values. The lowest (x<16) and the highest pixel values (x>240) are not taken into account though, for several technical reasons related to the measurement method and data analysis.
Figure 2 shows the results for the Acer XN253Q X and, for comparison, the BenQ XL2540. Clearly, the Acer is doing much worse in this test than the BenQ (SD=11.7% vs. SD=6.3%; smaller standard deviations are better), but this is not because the Acer is exceptionally bad, but because the BenQ is exceptionally good. With SD=11.7%, the Acer XN253Q X is still better than the ASUS VG248QE (SD=13.3%) or the BenQ XL2420T (SD=14.4%). The higher noise level of the Acer XN253Q X, as compared to the BenQ XL2540, is also reflected by a slightly worse color accuracy (dE2000=0.53 vs. 0.42, on average over 400 colors).

Settling behavior
Unless otherwise noted, the measurements shown here were taken after having reset the monitor to its factory settings. The Contrast setting was reduced from 50 to 48 throughout though, because at 50, bright colors already were at the brink of being crushed. The tests were run with an NVidia GeForce GTX 1050Ti graphics card under Windows 10, with G-Sync disabled. The monitor was connected through DisplayPort.
The measurements were made with a photo diode PDA36A (Thorlabs), the gain of which was set to 60 dB resulting in a bandwidth of 37.5 kHz and a minimal rise/fall time (10%-90%) of about 9 µs. The photodiode was placed at about 4.5 cm from the screen surface at a straight angle. Ambient light was kept from the measured area by a rubber sleeve of 3 cm diameter which also limited the maximal incident angle to about ±20°.
The vertical extent of the measured screen area was not only limited by the rubber sleeve but also by the stimulus being just a small horizontal stripe covering 5% of the screen height. Note that the LC cells are updated sequentially from the top of the screen to the bottom, which results in different delays for the luminance curves depending on the vertical measurement position. By limiting the measurement to only 5% of the full vertical screen size, the smear effect caused by averaging over differently delayed luminance signals becomes close to irrelevant. For example, at a refresh frequency of 120 Hz the screen is updated within around 8 ms, so if the true luminance would change instantly, the measured rise time would be 5%·8 ms = 0.4 ms, which is negligible here.
For more detailed information on the measurement method and the presentation of the results, see Flicker-free settling.
Settling curves
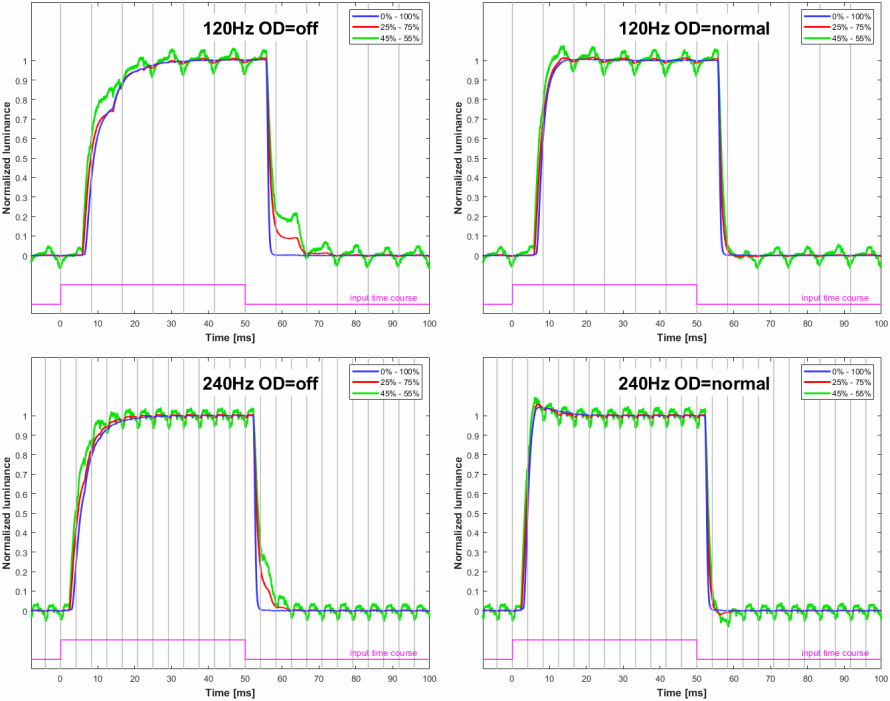
Figure 3 shows the luminance signals over time for the horizontal stripe being switched between gray levels 0%-100%, 25%-75%, and 45%-55% respectively. Note that these percent values refer to pixel values and not to luminance values, so the monitor's respective gamma transfer function would have to be taken into account when interpreting these values in terms of absolute luminance. The monitor allows only 3 different overdrive setting: "off", "normal", and "extreme". "Extreme" is clearly too much, which is why only curves for "off" and "normal" are shown.

The vertical gray lines mark the time when the OpenGL command sequence SwapBuffers();glFinish(); returns control to the PC program, which is about when the 1st line of the frame is sent out to the monitor. At this very moment, also a hardware trigger is updated (pink trace), which is recorded along with the photodiode signal. Measurements have been taken at the vertical middle of the screen.
At 120 Hz, the overdrive setting "normal" is as perfect as it can be, whereas it seems a bit too high for 240 Hz – still better though than no overdrive at all.
Surprisingly, the signal latency, i.e. the delay of the luminance onset with respect to the trigger onset (e.g., blue vs. pink trace in Figure 3), is higher than with other monitors, for example about 2 ms for a 120 Hz refresh rate and 1 ms for 240 Hz when compared to the BenQ_XL2540. Since the BenQ was still tested under Windows 7 and possibly with a different graphics card, which both can have an impact on when exactly the trigger signal is updated, the curves for the BenQ were re-measured with the new test setup. This just confirmed the old results. Note that the trigger signal is a hardware signal, which is recorded along with the photodiode signal but is still updated per software, namely right after the graphics card driver returns control to the application after having executed the frame switch. Therefore, the long latency observed here could be either caused by the monitor being slow or by the graphics card driver being quick in completing the frame switching task, thereby allowing the application to update the trigger signal earlier. The idea behind using the very same setup for comparing the two monitors regarding latency was, however, to rule out potential differences on the PC side, such as effects caused by having used different graphics card drivers. The observed difference could still be caused by the graphics card driver though, namely if the graphics card driver would behave somehow differently depending on whether the connected monitor supported G-Sync, even if G-Sync was disabled anyway (which it was when testing the Acer – the BenQ does not support G-Sync in the first place). Also having used different video timings, like normal LCD timing vs. reduced LCD timing, could have caused the difference, but exactly the same timings were used for both monitors. So there is quite some evidence that it is just the Acer, which is a bit slow.
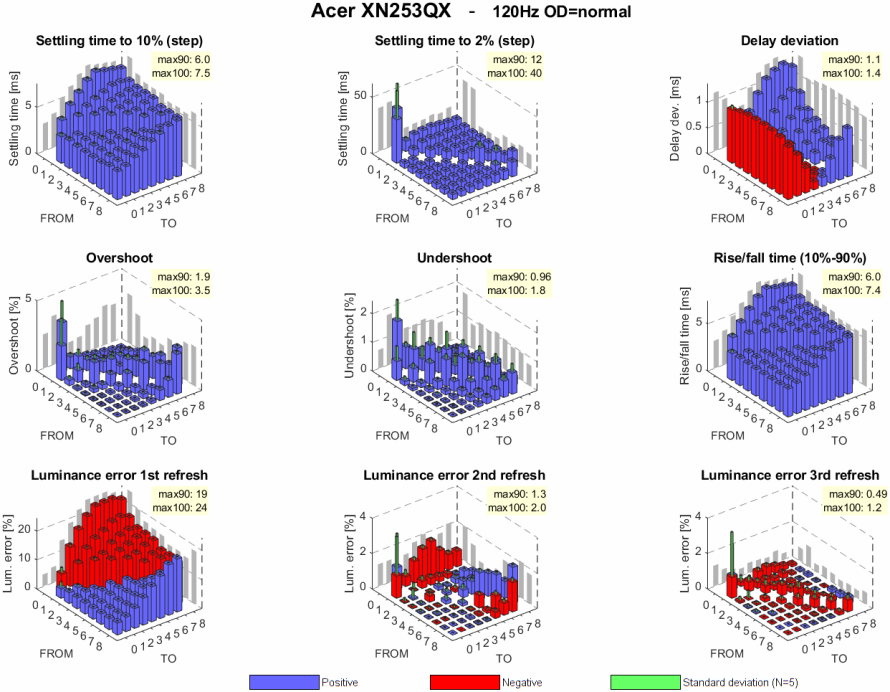
Settling matrix measurements

240 Hz data: [1st view] [2nd view]
For further details on the graphs and the measurement method see Flicker-free settling.
Figure 4 shows a few characteristics of the pixel luminance settling when systematically switching the pixels between a set of FROM and TO values. For more information on the methods and data presentation, see Flicker-free settling.
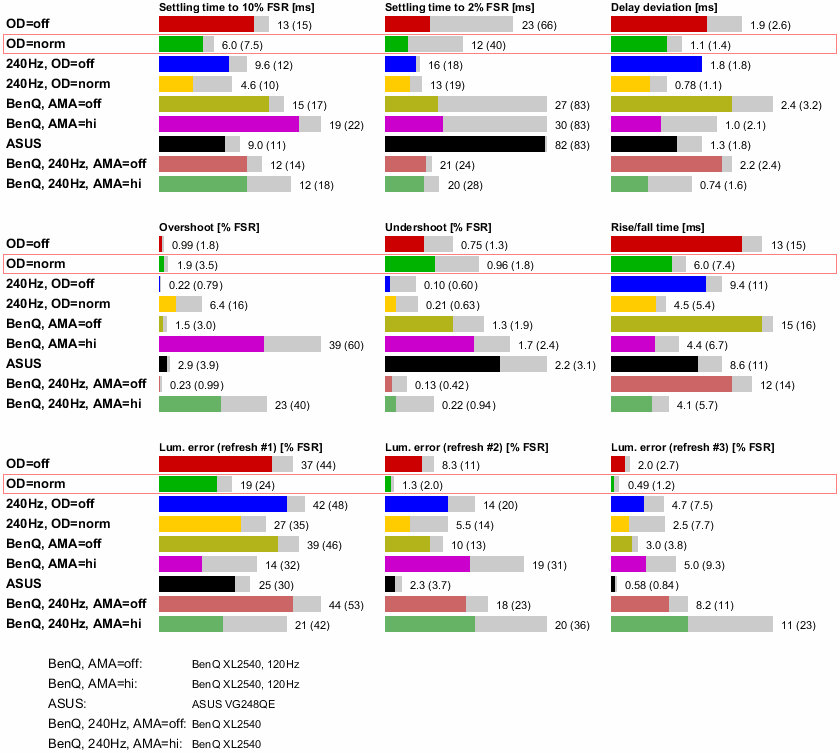
Even when compared to a monitor with a very similar panel and under similar conditions like, for example, the BenQ XL2540 at 120Hz and with AMA=high, the comparison is difficult, because it all changes with how well the overdrive is adjusted. The BenQ uses a more aggressive overdrive than the Acer, which is reflected by the high overshoot seen in the BenQ data. This aggressive overdrive also spoils the comparison of the rise and fall times, because these times are evidently smaller with more aggressive overdrive. The BenQ has a 1st generation 240 Hz panel, whereas the Acer has the 2nd generation equivalent, which is supposed to be faster. The measurements for the overdrive case do not necessarily support this. However, when comparing the no-overdrive measurements, the Acer indeed performs a bit better (compare "OD=off" and "BenQ, AMA=off" in Figure 5).

The red frame marks the supposedly best case for 120 Hz), which is also shown in the 3D matrix plots above.
The results for the BenQ XL2540, which has a very similar 240 Hz TN panel, are provided for comparison.

