EIZO FORIS FG2421: Difference between revisions
mNo edit summary |
(No difference)
|
Latest revision as of 08:49, 7 September 2022

Specifications
| Brand: | EIZO |
|---|---|
| Model: | FORIS FG2421 |
| Size: | 23.5" |
| Resolution: | 1920x1080 |
| Panel type: | VA |
| Max. refresh rate: | 120 Hz |
| Panel: | SHARP LQ235D1LW03 |
| Processor: | MST 8757T (MSTAR) |
| Backlight type: | LED (white, edge) |
| LED driver: | BD9276EFV |
| TachistoMode: | no, not really |
| Price (approx.): | USD 600 |
| Monitor release date: | 2013-12 |
| This review's date: | 2013-11 |
Reviews
EIZO FORIS FG2421 review on TFT CENTRAL.
EIZO FORIS FG2421 review on FlatPanelsHD.
At a glance
The EIZO FORIS FG2421 is the first monitor with a VA panel (Vertical Alignment) operating at 120 Hz and a flashed LED backlight. The VA panel promises much better color quality and higher contrasts over a wider range of viewing angles as compared to 120 Hz monitors with TN panels that also offer flashed backlight mode in form of 2D LightBoost (e.g. BenQ XL2420T or Asus VG248QE). Another plus on the FG2421’s side is the high brightness (400 cd/m2), which is still high (250 cd/m2) when the monitor is operated in flashed backlight mode.
First reviews on the EIZO FG2421 were extremely positive, but meanwhile also more critical opinions have been voiced. The bottom line of this mini review is that the FG2421 is not so much more than a proof of concept, the concept being to combine a VA panel with 120 Hz flashed backlight technology. There are numerous problems which are rather attributable to sloppy design and manufacturing than to technology itself. This is disappointing and somewhat unexpected given that EIZO usually knows how to build good monitors and given that the price tag of this monitor is well above other 120 Hz monitors. But EIZO is to blame only for part of the problems as the VA panel, which accounts for the other part, is manufactured by SHARP.
Issues
In the following, several issues are discussed in more detail. First off, when reading the respective forums one can get the impression that there is a huge variability in the manufacturing quality. But most of this is probably just because of different observation standards and, more importantly, different settings and test conditions. Also, some problems seem to surface only occasionally or under very specific conditions. Nevertheless, such problems should not be ignored unless it is clear under which circumstances they do occur and how to work around them. Otherwise, according to Murphy’s law, such problems will not only appear in tests that have been tailored to make them appear but will also pop up in real applications.
Color resolution
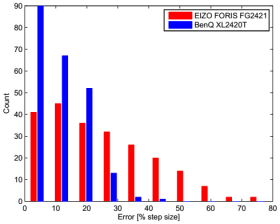
The VA panel is a 10bit device but operated at 8bit+FRC (i.e., virtually 10bit, according to the TFT CENTRAL review). However, the effective color resolution also depends on the pixel value processing, which seems to be worse (by 40% or so) for the EIZO in terms of systematic errors as compared to the BenQ XL2420T which only has a 6bit+FRC panel (see Figure 1 and Measuring color resolution). This becomes most obvious at dark levels where the perceived step sizes between adjacent input levels are not only quite big but also quite non-uniform (Lagom black level test). That this non-uniformity is actually caused by systematic round-off errors and not just by some other non-linearities can be also seen when sweeping through the monitor’s contrast setting, which causes according changes in the pixel value calculations. What can be observed then is how the luminance of the different gray patches are "jumping" to the next level at different contrast settings (best seen in a dark room when looking at the monitor from above).
Note that the effective color resolution is difficult to quantify, as there is a lot of variation, and the perceived step sizes along with the step size errors are getting exaggerated by EIZO's deep black levels. Although it seems to be safe claiming that the EIZO is doing worse, it is not to an alarming extent.
A general problem regarding color resolution comes with the high contrast ratio the EIZO provides, because the dynamic range that has to be covered by the available pixel values is much wider than for monitors with more traditional contrast ratios. With only 8bit per channel, cut-backs in perceived color resolution are inevitable. These cut-backs occur mainly at low luminance, which is a consequence of the (historical) choice of gamma. So there is obviously a trade-off between color saturation and perceived color resolution, especially when it comes to low luminance (see also the Black level section).
By the way, a high black:white contrast ratio does not necessarily mean high color saturation. A red pixel, for example, gets washed out (i.e., desaturated) because the blue and green sub-pixels of that pixel are not perfectly dark. This is due to an imperfectly dark black level (as measured for the maximal contrast ratio) and due to stray light coming from the red sub-pixel. Note that colors on an LCD are produced by color filters sitting at the very end of the light path, so stray light is still white before passing the filters.
Viewing angle
TN panels are known to have small viewing angles, meaning that the color saturation and color hue do change substantially when looking at the monitor from different angles. VA panels are better in this respect but suffer from a different effect called gamma shift. Although the color saturation and color hue stay pretty constant over a wide range of viewing angles, the gamma transfer function does not, as shown in Figure 2. This might cause, for example, dark levels to vanish in the black when looking at the monitor from a straight angle.
Flashed backlight
The monitor can operate in TURBO-240 mode (TURBO mode, for short), in which case the LED backlight is not constantly on but is flashed in synchrony with a 120 Hz frame rate. This mode is only free of timing artifacts with an input frame rate of 120 Hz, which is internally doubled to 240 Hz (about applicable frame rates, see below). The important thing regarding backlight is that the backlight is actually flashed twice per 120 Hz frame, as can be seen in the right panel of Figure 3. The first pulse (pre-strobe) is very short though (270 µs), whereas the second pulse (main strobe) is between 2.1 and 2.5 ms long, depending on the Brightness setting (below Brightness=75%, the LED current is changed, above 75%, the strobe pulse width is changed). The pre-strobe is placed in the middle of two main strobes and might have just been added to somewhat alleviate flickering. This goes, however, somewhat against the idea of motion blur reduction.
On the positive side is the output luminance range, which goes from 45 cd/m2 to 285 cd/m2 (245 cd/m2 at Brightness=75%, i.e., max. luminance at minimal pulse width).
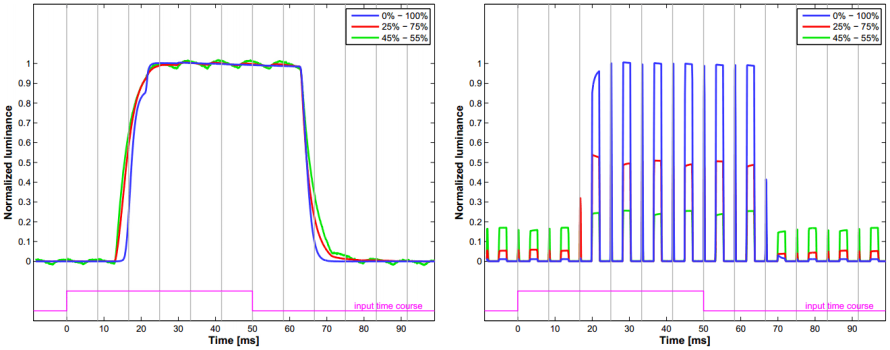
The vertical gray lines mark the ends of the VSync intervals (i.e., when the 1st line of a frame was about to be sent out by the computer). Measurements have been taken at the screen center with the photo diode PDA36A (Thorlabs).
Anyway, from a technological point of view, flashing the backlight is not a big deal. What is a big deal though is the adjustment of the overdrive amplitude so that it results in a fast and accurate output luminance settling in combination with the pulsed backlight. Here is where 240 Hz can make the difference, not because it is double the refresh rate but because it allows the panel to be updated in half the time, leaving enough settling time even for the bottom pixels before the backlight pulse renders them visible. Whether the internal 240 Hz refresh frequency is used to its full potential, like calculating and applying overdrive also at a 240 Hz frequency, is a different question; but even if it is just the faster update speed that is put to a use, it is an improvement over, for example, the BenQ XL2420T which is only able to update the panel within about 6 ms.
Besides the small pre-strobe that might somewhat diminish the motion blur reduction, there is another issue with the TURBO mode. This is a 60 Hz luminance modulation: every other long pulse is a bit darker than the other. This modulation is permanent and the modulation amplitude seems to depend on the vertical pixel position, which indicates that this effect is not caused by backlight control. The modulation phase, i.e., which pulse is higher, does not depend on the input signal. The modulation can bee seen in the red and the green curves at the right panel of Figure 3. Note the hi-lo pattern for the green curve is reversed as compared to the red curve. This is so by accident and just indicates that the modulation phase does not depend on when, for example, the first bright frame was presented.
The artifacts are the stronger the more of the screen is covered by the test pattern. As the browser window is made smaller, the patterns look more like they are supposed to look, i.e., the horizontal lines become weaker and the color does change towards gray.
With some other test patterns the monitor flickers very strongly.
The artifacts are much weaker in non-TURBO mode (e.g. monitor mode setting WEB).
Pixel inversion ( pixel-walk)
The pixel state depends on the DC voltage applied to the liquid crystals. In order to not compromise the molecular structure of the liquid crystals, die polarity of the voltage needs to be switched from time to time. This is what pixel inversion refers to. It is difficult, however, to maintain the exact absolute voltage level for both voltage polarities and, thus, the pixel state varies accordingly. So in order to not induce flicker by this voltage polarity switching, the two different polarities “+” and “-“ are distributed across the sub-pixels and are switched with each panel refresh. Normally, special test patterns are used to make just the difference between the “+” and the “-“ voltage visible. But these patterns do not only reveal static differences between the voltage polarities but also show how stable the voltage sources are, possibly depending on the currently applied pixel pattern and the pixel location. This is where the EIZO FG2421 shows some unexpected weakness. Especially in TURBO mode, where basically only every other internal refresh phase becomes visible and thus half of the averaging potential regarding pixel inversion gets lost (namely averaging inversion effects over time), weird artifacts appear. This would not be so alarming if these artifacts were not so severe for certain monitor settings, suggesting that under certain circumstances pixel inversion effects can be clearly visible also without provoking them by tailored test patterns.
Such strong artifacts can be observed when looking at the Lagom Pixel-walk tests while in TURBO mode and while sweeping through the monitor's black-level setting (Figure 4). Here, the black-level setting is just used to easily change the gray levels of the dark sub-pixels in the test patterns. It is likely that the same effect can also be elicited while keeping the black-level setting fixed but, instead, sweeping through different gray levels as the test pattern are generated (which is not implemented at the Lagom site).
These test patterns are tailored to reveal pixel inversion artifacts. However, this does not necessarily mean that the observed artifacts are all caused by pixel inversion. Other causes are also thinkable which are triggered by these test patterns just by accident.
Input lag
The EIZO FG2421 shows more input lag than many other 120 Hz monitors. Input lag is difficult to measure and there are also several definitions out there of what input lag means, especially when it comes to monitors with flashed backlight. If taking the end of the input signal's VSync as a reference, which is when the computer sends out the first pixel line, the luminance curve measured at the screen center crosses the 50% mark with a delay that is about 10ms longer for the EIZO FG2421 than for the BenQ XL2420T. This is the case in TURBO/LightBoost mode (pre-strobes in TURBO mode not taken into account) but also when backlight is permanently on (see Figure 3 and Figure 5 for comparison).
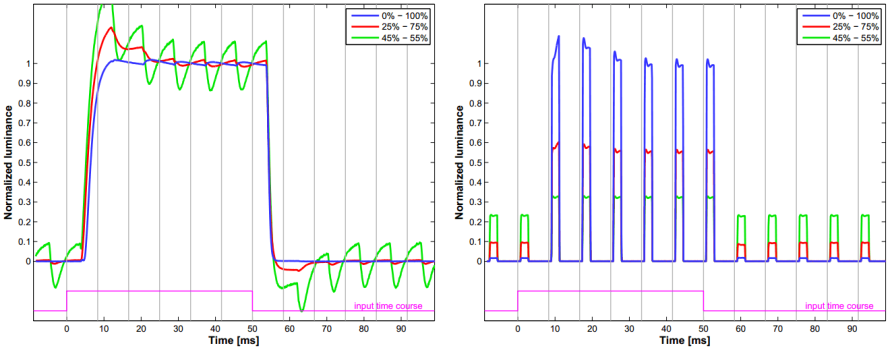
The vertical gray lines mark the ends of the VSync intervals (i.e., when the 1st line of a frame was about to be sent out by the computer). Measurements have been taken at the screen center with the photo diode PDA36A (Thorlabs).
Frame rates
The high input lag already suggests that the EIZO FG2421 first buffers the input frames before forwarding them to the panel. Although the monitor accepts refresh rates other than 120 Hz, the internal processing seems to keep running at a 120 Hz frame rate no matter what. Note that there is no tearing when the monitor is fed with, for example, a 100 Hz signal, but input frames are sometimes presented for two 120 Hz time periods in order to bridge accumulating time gaps that are inevitable when trying to fit 100 Hz in a 120 Hz time raster. This makes 120 Hz basically the only applicable refresh frequency.
AG coating
The EIZO FG2421 comes with a semi-glossy anti-glare coating that reduces reflections much less than the matte coating of the BenQ XL2420T or Asus VG248QE. On the other hand, this also means that less stray light coming either from the monitor itself or from the room illumination, which helps to preserve the image contrast and results in slightly less image blur. Which coating strength is best really depends on the application and personal preference. However, the coating of the EIZO FG2421 suffers from something called cross-hatching, an artifact probably caused by the adhesive between the coating foil and the panel glass not being distributed homogeneously. Some describe this artifact as patterns of faint diagonal lines across some screen areas, possibly seen only at certain gray levels and/or at certain colors and/or under certain viewing angles. But even if line patterns are not clearly visible, the panel might still look kind of patchy or splotchy because of cross-hatching. This is one of these effects which are almost impossible to document by camera pictures, and reports regarding these effects might be very subjective. Therefore, it is not so clear whether this is a general problem basically all FG2421 monitors will show or whether only some bad samples are affected.
Black level
VA panels generally exhibit very dark blacks, which results in a high white:black contrast ratio. However, as far as the EIZO FORIS FG2421 is concerned, this comes at a price. The panel needs a rather long time to switch from completely black to any other level. This is especially true when switching from deep black to levels which are just close to black, a fact also mentioned in the TFT CENTRAL review. That there is something to it can be also seen from measurements for black-to-white switches (not shown here) where the rising edge of the luminance curve is delayed by about 2.5ms as compared to a dark-to-white switch. To some extent, this can be also seen in the left panel of Figure 3, where the onset of the blue curve (black-white switch) clearly lags behind the other curves for the rising but not for the falling edge.
In general, a higher maximal contrast means that a wider dynamic range has to be covered by the limited number of available pixel values. Even if the monitor made optimal use of the available value space by minimizing digital noise and by applying an optimal gamma function (which would have to be supported by the imaging software as well), the perceived difference between two adjacent gray levels would still have to become bigger at some point. The generally used gamma value is, however, not optimized for such high contrasts and neither is the nominal color resolution of 8bit per channel really sufficient to cover contrast ratios like 5000:1 as found in the EIZO.
Backlight bleed, glow
The EIZO FORIS FG2421 does not show any signs of conventional backlight bleeding, which otherwise would be visible on a pitch black screen already. However, at levels a bit brighter than pitch black the monitor seems to glow here and there, especially along the right edge and with some greenish tint, as shown in Figure 6. This has been reported by several people and it is seen as one of the weakest points of the EIZO FORIS FG2421.
VESA mount
The EIZO FORIS FG2421 does not provide holes for a VESA mount. However, it is apparently pretty simple to remove part of the back cover and still attach a VESA mount.
Matrix measurements
Flicker-free backlight
Evaluating the flicker-free backlight mode (TURBO240=off) is relatively easy because the EIZO FORIS FG2421 does not offer any user settings regarding overdrive which could have an impact on the settling behavior. As already mentioned in the Black level section above and as can be inferred from Figure 7, the EIZO is rather slow when switching from black (FROM=0) to dark gray levels (TO<5 or so). Apparently, the EIZO is driven well into saturation when presenting black and needs quite some time to get out of saturation, especially if the target level is close to black and, thus, does not provide much of a pull. Raising the Blacklevel setting improves the situation somewhat and might also help to alleviate the problems mentioned earlier regarding excessively high B/W contrasts, obviously at the price of a slightly increased black luminance and, thus, reduced B/W contrast (e.g., matrix plots for BL=60%,C=50%). Another concern is the Contrast setting, which might be too high to provide enough overdrive margin at all luminance levels. But reducing the Contrast setting from 50% to 40% does not result in an improvement; it is rather the contrary. A few more conditions are shown in the comparison chart (Figure 8).

For further details on the graphs and the measurement method see Flicker-free settling.
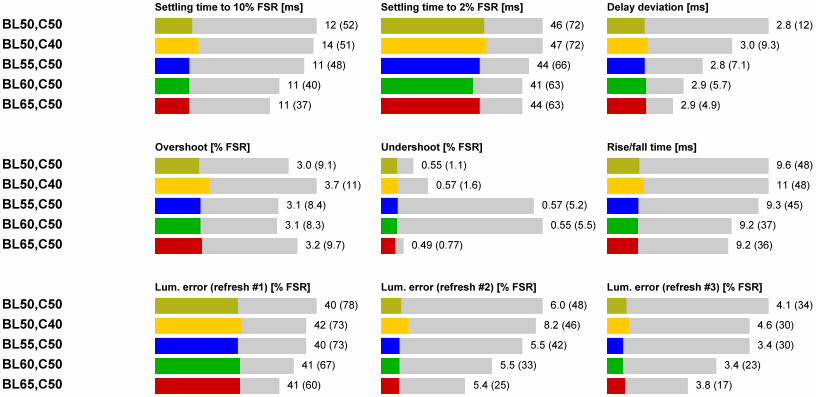
For further details on the measurement method see Flicker-free settling.
Strobed backlight
The measurements for the strobed backlight (TURBO240=ON) were taken when the strobe pulse width was set to its minimum (2.1 ms, i.e., with a Brightness setting of below 75%, providing a maximal luminance of 245 cd/m2). Note, that the luminance errors refer to the average luminance during one entire refresh cycle, meaning that the errors are also affected by the 270 µs long pre-strobe. Because the overdrive margin depends on the contrast setting, measurements were taken at two different Contrast settings (40% and 50%), but overall the C=40% case is actually a bit worse, which suggests that overdrive has been optimized for C=50%. So only the C=50% case is shown here (Figure 9). Note that the occasionally big worst case errors are dominated by switching from dark to dark, which might be only of minor practical relevance. Thanks to the internally doubled refresh frequency, which comes with an accordingly high panel update rate and gives the pixels a quite long settling time before the main backlight strobe, the errors are well balanced across the different screen locations (top vs. bottom). Actually not so good are the high residual errors at later refresh cycles. The measurements might even underestimate the true errors as they are averaged. This is because at least part of these errors are caused by the weird 60 Hz luminance signal modulation, which can be well seen in the right panel of Figure 3. Since the measurements were not synchronized to the phase of this luminance modulation, the according negative effects on the error measure did have a good chance to average out, at least to some extent.

For further details on the measurement method and presentation see LightBoost settling.

Note that the occasionally 100% errors (gray bars) might be of minor practical relevance as they are often dominated by just dark-to-dark switches.
For further details on the measurement method see LightBoost settling.
| Pin | Signal |
|---|---|
| 1 | 18.2 V |
| 2 | 18.2 V |
| 3 | 18.2 V |
| 4 | 18.2 V |
| 5 | GND |
| 6 | GND |
| 7 | GND |
| 8 | 3.3 V |
| 9 | LED current control, (3.3 V PWM @ 18 kHz) The PWM ratio controls the DC LED current level, which |
| 10 | LED on/off, Strobe (high-active) |
Accessing the backlight signals
Due to its extremely low black luminance, the EIZO FORIS FG2421 would be perfectly suited for tachistoscopic applications. Unfortunately, the LED driver is not so well suited. Preliminary findings reveal several problems. After a few seconds of inactivity the LED driver switches off completely and can only brought back to life by switching the power off and on again. The onset behavior after an inactivity of up to 500 ms is pretty good, but the longer the pause the more noise does the onset make. Even if the LED driver would tolerate such operation conditions on the long run, the noisy indication of the onset might be prohibitive for the application at hand.
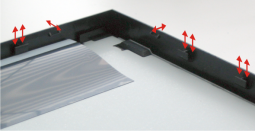
Disassembling the monitor is not particularly difficult. First, the upper plastic cover of the stand has to be clipped off, which uncovers 3 screws that have to be removed. Somewhat unusual, the back cover is screwed to the interior by another set of 3 screws. Other than that, the back cover is just clipped in, but care should be taken when taking it off, so that the plastic hooks connecting the bezel to the back cover do not get ripped off (see Figure 11).
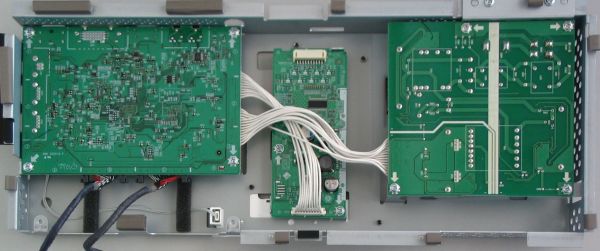
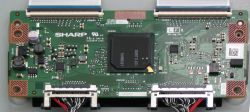
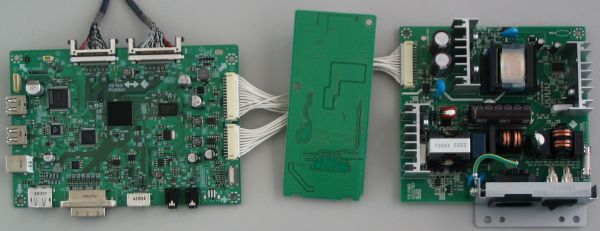
Inside, there is the main box with three PCBs, the main board, the LED driver, and the power supply (Figure 12 and Figure 14). The main board actually does not connect to the panel controller but connects to a forth PCB first, which is directly mounted on the panel (Figure 13), possibly a signal level converter of some sort.
