Razer Raptor 27 165Hz

1 Specifications
| Brand: | Razer |
|---|---|
| Model: | Raptor 27 165Hz |
| Size: | 27" |
| Resolution: | 2560x1440 |
| Panel type: | IPS |
| Max. refresh rate: | 165 Hz |
| Panel: | INX M270KCJ-K7B (Innolux) |
| Processor: | RTD2717Q (Realtek) |
| Backlight type: | LED (white, edge) |
| Price (approx.): | USD 700 |
| Monitor release date: | 2021-08 |
| This review's date: | 2024-12 |
2 Reviews
Razer Raptor 27 165Hz review on RTings.com.
3 At a glance
This monitor is built like a tank, which also shows in the price. The fancy design features are not always of advantage though and, from a technical point of view, this monitor does not differ that much from all the other IPS 2K monitors in the 170 Hz class. The monitor was purchased and tested mainly because RTings.com gave it an exceptionally good "Gradient" rating (10/10), which fueled some hope that this would correspond to an above-average color processing performance. Unfortunately, this could not be confirmed here. Still, being IPS and offering 10 bpc input signals up to its maximum refresh rate of 165 Hz, this monitor performs well in the color department – just not exceptionally well. Regarding pixel response timing, and according to the RTings.com's test results, this monitor performs rather badly, worse than about 2/3rd of the 170Hz-class IPS monitors tested at RTings.com. It has an average rise/fall time of 4.4 ms, while many other monitors in this class reach 3-3.5 ms. Similarly, it has a total response time of 9.4 ms, while many other monitors reach 6.1-7.0 ms.
240Hz-class IPS monitors would have a better pixel response time, but from own experience and after studying RTings.com's test results, these ever increasing refresh rates seem to go hand in hand with an ever decreasing maximum contrast, with ever more IPS glow, and with ever worse gray and white uniformity. This makes TN panels look attractive again – if there wasn't OLED which is starting to become a viable option.
4 Design issues
The stand is certainly one of a kind, made of mostly 10 mm thick metal, with bits and pieces for cable management. It features some LED lighting around the very bottom, which can be disabled though. The stand does not allow for any swivel or rotation adjustment, and the height adjustment has a limited maximum height of 48 cm (as measured from the table surface to the top of the screen image). The monitor comes with a full set of fancy green and flat cables, with right-angled connectors at the monitor end. For threading the cables through the cable management, the screen is supposed to be tilted all the way back to horizontal, which is pretty hard to do due to the stiff tilt mechanism. The cable routing is very snug, tailored to the specifically shaped cables that come with the monitor, meaning that the cable management is less suited for standard cables. The better part of the backside of the monitor has a textile surface. Probably because of design considerations, there is no Kensington lock and the device identification label plate, which is actually missing the manufacturing date, is found on the underside of the stand. If one needs a VESA mount, one has to purchase an according adapter separately.

5 Firmware
The tested unit was manufactured in 07/2021 and came with firmware version v1.04, which was updated to v1.06 (v1.06_r4, released 11/2021). The update is pretty painless, provided one has a PC with an USB-C graphics card output.
BTW, the v1.06_r4 changelog says:
- Remove the “THX darkroom” option from on-screen controls.
- Improve overdrive for each refresh rate.
One hopeful interpretation of the last point is that there are different sets of overdrive coefficients, one per implemented refresh rate (good), which would be in contrast to having just one set of coefficients for all refresh rates (bad).
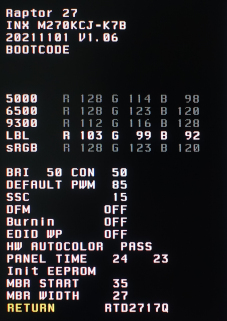
It is currently unknown how to make the service menu available. The screenshot shown here was captured after the service menu became available accidentally, likely due to a malfunction that could not be reproduced.
7 Motion blur reduction
The monitor provides an option for motion blur reduction (aka strobe backlight or black frame insertion). But this was not tested – not only because of lack of interest, but also because the panel is an IPS panel. Although IPS panels are catching up with TN panels in terms of pixel response times, the 165Hz-generation of IPS panels is still not quite there yet. Moreover, this monitor suffers from the "slow red phosphor" issue, which substantially impairs the motion blur reduction. In normal mode, the slow red phosphor is completely irrelevant though.
8 Saturation

When it comes to color accuracy, one potential problem lies in the interactions between the primary color channels (Red, Green, Blue) when rendering arbitrary colors &ndash White, for example. For White, if everything was perfectly accurate, the luminances of the primary colors would add up to LW=LR+LG+LB(=LRGB for short). Deviations from this perfect relationship can be quantified by the (normalized) error Δe=(LRGB−LW) / LRGB (see Figure 1). We can interpret this error also as saturation error, de-saturation, or cross-talk coefficient. Note that this measure also includes de-saturation effects caused by background illumination, which becomes overly dominant for dark shades, which is why they have been excluded from the graphs shown in Figure 1. The Razer performs very well, even when compared to a different IPS panel (ASUS MG279Q), let alone even a good TN panel (BenQ XL2540), although the Razer does a bit worse at dark shades. The just described error measure should also correlate well with the more familiar dE color accuracy value reported on other review websites. Indeed, the dE2000-values (averaged over 400 colors) for the three monitors compared here are dE2000 = 0.152 (Razer), 0.205 (Asus), and 0.42 (Benq).
9 Color processing noise
Ideally, the monitor processes incoming pixel values so that the according output luminance follows a smooth transfer function. This processing usually takes place in the digital domain, while aiming for some favorable Gamma characteristic and taking other parameters into account, like the Contrast settings, the RGB channel gain settings, and also spatial or spatio-temporal dithering. One way of quantifying how consistently this is done for all pixel values, without needing to know the targeted Gamma characteristic, is to measure deviations from a smooth transfer function. Here, we do not focus on how well the transfer function is described by a simple Gamma function but, rather, how well the measured data points can be described by any reasonable smooth transfer function. We only measure one color channel here to isolate artifacts which otherwise might be obfuscated when looking at a mixture of multiple color channels. We choose the Green channel, because it is the brightest of the 3 color channels and, thus, provides the best signal-to-noise ratio. The lowest (x<16) and the highest pixel values (x>240) are not taken into account here for several technical reasons that are related to the measurement method and data analysis.
Figure 2 shows the results for the Razer Raptor 27 165Hz and, for comparison, the BenQ XL2540. For this comparison, the Razer was operated at 8 bpc in order to match the capabilities of the BenQ which accepts only 8 bpc inputs. Clearly, the Raptor is doing much worse in this test than the BenQ (SD=11.6% vs. SD=6.2%; smaller standard deviations are better), but this is not necessarily because the Razer is exceptionally bad, but because the BenQ is exceptionally good in this test.

Here comes the interesting part. What happens when using a color resolution of 10 bpc? On the PC side, this test is programmed to always use an 8 bpc processing pipeline with a 1:1 gamma table, i.e., a gamma table that does not change the 8 bpc color values that the test program wrote into the 8 bpc frame buffer on the graphics card. Therefore, even for a 10 bpc-capable monitor like the Razer, the measured processing noise should not depend on the color resolution (aka color depth) that is used for sending the data over the cable, be it 8 bpc or 10 bpc. And indeed, this is exactly the behavior that was observed with at least one other 10 bpc-capable monitor model, that is, the measured data points were basically the same, no matter whether the color depth was selected to be 8 bpc or 10 bpc. With the Razer, however, this is different. With 10 bpc color depth, the Razer clearly shows less color processing noise than with 8 bpc (SD=8.2% vs. 11.6%, see Figure 3), even though this is still somewhat worse than the BenQ with 8 bpc (SD=6.2%). It is not clear yet where exactly this difference comes from and why it is so relatively big. Using 10 bpc color depth turns out to be more of a rabbit hole than anticipated, even without having tried to establish a full-blown 10 bpc processing pipeline at the application level and possibly using a non-identity gamma table. Counter-intuitively, 10 bpc being better in this test than 8 bpc is actually harder to explain than if it were the other way around. Therefore, these results suggest that the 8 bpc performance is not worse because of technical limitations but because of subpar firmware implementation. Or put more positively, where other monitor might show a more balanced performance between 8 bpc and 10 bpc modes, the Razer seems optimized specifically for the 10 bpc mode, at the expense of the 8 bpc mode.
10 Settling behavior
Unless otherwise noted, the measurements shown here were taken at 250 cd/m2 after having reset the monitor to its factory settings. The Contrast setting was reduced from 50 to 48 throughout though, because at 50, bright colors already were at the brink of being crushed. The tests were run with an NVidia GeForce GTX 1050Ti graphics card under Windows 10, with G-Sync disabled. The monitor was connected through DisplayPort.
The measurements were made with a photo diode PDA36A (Thorlabs), set to a gain of 60 dB, which results in a bandwidth of 37.5 kHz and a minimal rise/fall time (10%-90%) of about 9 µs. The photodiode was placed at about 4.5 cm from the screen surface at a straight angle. Ambient light was kept from the measured area by a rubber sleeve of 3 cm diameter which also limited the maximal incident angle to about ±20°.
The vertical extent of the measured screen area was not only limited by the rubber sleeve but also by the stimulus being a horizontal stripe covering just 5% of the screen height. Note that the LC cells are updated sequentially from the top of the screen to the bottom, which results in different delays for the luminance curves depending on the vertical measurement position. By limiting the measurement to only 5% of the full vertical screen size, the smear effect caused by averaging over differently delayed luminance signals becomes close to irrelevant. For example, at a refresh frequency of 120 Hz, the screen is updated within around 8 ms, so if the true luminance would change instantly at a pixel or pixel line level, the rise time (0% to 100%) measured for the stripe would be 5%·8 ms = 0.4 ms, which is negligible here.
For more detailed information on the measurement method and the presentation of the results, see Flicker-free settling.
10.1 Settling curves
Figure 4 shows the luminance signals over time for the horizontal stripe being switched between gray levels 0%-100%, 25%-75%, and 45%-55% respectively. Note that these percent values refer to pixel values and not to luminance values, so the monitor's respective gamma transfer function would have to be taken into account when interpreting these values in terms of absolute luminance. The monitor offers only 3 different overdrive settings: "off", "weak", and "strong". All these options result in reasonable settling behavior, but "weak" overdrive appears to be the best compromise between slow settling and excessive overshoot. Subjectively, this is also the case when going by the edge artifacts that can be seen in a moving gray-level mosaic stimulus.

The vertical gray lines mark the time when the OpenGL command sequence SwapBuffers();glFinish(); returns control to the PC program, which is about when the 1st line of the frame is sent out to the monitor. At this very moment, also a hardware trigger is updated (pink trace), which is recorded along with the photodiode signal. The photodiode was placed at the screen center.
Notice that overdrive has no effect when switching between 0% and 100%, which is normal and just means that there is no modulation headroom available at these levels that could be used for overdrive. The settling behaviors for the rising and the falling edges looks very similar, which is typical for IPS panels, in contrast to TN panels, where the bright-to-dark transition is faster than the dark-to-bright transition. The "weak" overdrive is nicely balanced for both frequencies alike, 120 Hz and 165 Hz, which is not necessarily self-evident.
10.2 Settling matrix measurements
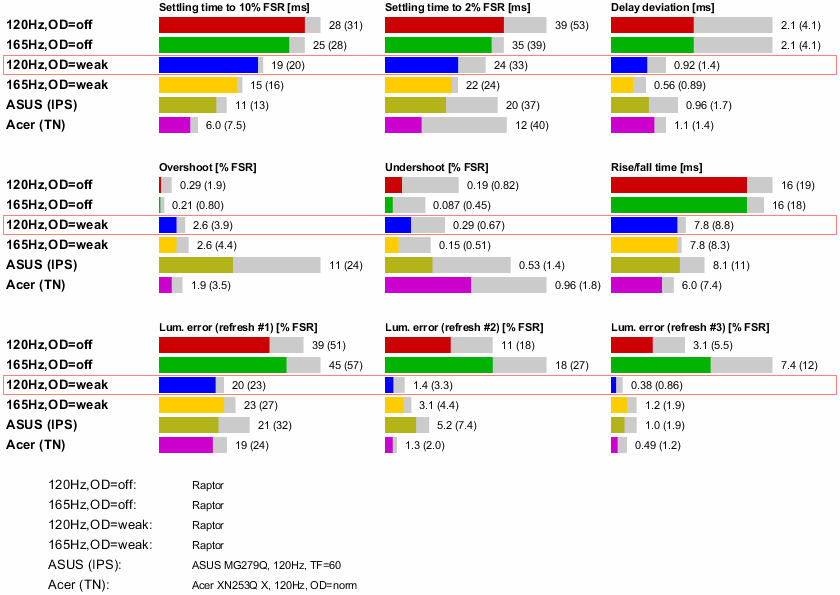
Figure 6 shows a few characteristics of the pixel luminance settling when systematically switching the pixels between a set of FROM and TO values. For more information on the methods and data presentation, see Flicker-free settling.

For further details on the graphs and the measurement method see Flicker-free settling.

The red frame marks the supposedly best case for 120 Hz), which is also shown in the 3D matrix plots above.


