Measuring color resolution
Motivation
The following measurements have been taken in order to quantitatively compare how well the EIZO FORIS FG2421 handles pixel data processing (e.g., applying RGB gain, contrast, and gamma settings, and possibly dithering) in comparison to the BenQ XL2420T. This was motivated by having observed non-uniform and rather big step sizes between dark grays on the EIZO while playing with the Lagom Black level test. The problem is, of course, that the visual sensitivity for luminance differences scales with the luminance level, that is, the darker it gets the smaller the just detectable luminance steps are (like in terms of cd/m2, see also Weber's law). Since the EIZO presents black about 4 times darker than the BenQ, which results in a 4 times higher maximal contrast ratio, it is more difficult for the EIZO to present dark gray steps that appear as small and as uniform to the eye than it is for the BenQ. However, the question about the digital noise added by data processing can be answered in isolation of this high-contrast issue.
Color resolution is normally specified in terms of bit-resolution, e.g., 8 bit per color channel. But this does not tell much about how accurately the monitor's input value will finally be translated to the output value (meaning the luminance) with respect to some theoretical transfer function (like the gamma function). When talking about inaccuracies here, we mean systematic inaccuracies, particularly those induced by digital "noise". The basic assumption in the approach followed here is that the systematic inaccuracies can be identified as the deviations from an otherwise smooth transfer function. In this case, all that needs to be done for assessing the digital noise level is to measure the transfer function, fit the measured transfer function with a reasonably smooth curve, and finally look at the residual errors with respect to this curve. The first derivative of the fitted curve allows translating the residual errors, which initially refer to the luminance domain, back into the input value space and, thus, report the errors in units of LSB (least significant bits) or alike, a scale in which the errors are independent of the particular absolute luminance level.
Method
The measurements have been taken with a Minolta CA-210 colorimeter. The optical probe of the colorimeter integrates light over a diameter of about 3 cm and an angular range of ±2.5°. The probe was directed at a right angle and directly touched the screen with its rubber sleeve. In order to keep things simple, only the Green channel was measured. Green was chosen because it is the brightest of the three primary colors and, thus, promised the lowest measurement noise. The luminance of each possible Green level was measured (256 levels according to an 8bit input signal), going from low to high values, one at a time. The Minolta delivers measurements at a rate of about 20 readings/s. After stepping up to the next input value and once the readings stabilized, 4 subsequent readings were averaged and saved as one data point. This way, measuring one gamma curve took about 4 minutes, and each gamma curve was measured twice in order to allow for a rough repeatability error estimate.
Measurement conditions
The monitors were operated at maximum brightness with LightBoost/TURBO mode disabled. Note that for both monitors the brightness is regulated through the backlight and should not have had any effect other than linearly modulating the output luminance and, thereby, increasing the S/N ratio of the luminance measurements. On the EIZO, Contrast was set to 40%, Background to 50%, and Gamma to 2.2. On the BenQ, Contrast was set to 40% and Gamma was set to "Gamma3". The contrast levels were chosen so that the gamma curves did not show any signs of saturation for high input values. The measurements were taken at two different gain levels for Green: 100% and 80%. A gain of 100% was expected to provide the best case scenario regarding digital noise, whereas gains other than 100% were expected to involve calculations that come at some cost in the form of additional round-off errors, that is, additional digital noise.
Data analysis
Regular gamma
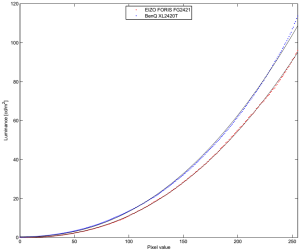
In a first step, the two gamma curve measurement repetitions were averaged before a gamma function was fitted, allowing for 4 free parameters: input offset, luminance offset, luminance gain, and gamma. The data points were weighted with min{1/x, 20}2, x being the normalized pixel value and 20 being an arbitrary limit. This weighting scheme relates errors to the nominal step sizes assuming a gamma value of 2. The nominal step sizes, in turn, are proportional to the first derivative of the gamma function, i.e., proportional to x in the case of gamma=2.
Figure 1 show the measurements (colored dots) and the fits (black curves) for GainG=80%. The fitted gamma value was 2.3 for both monitors.
Smoothing splines
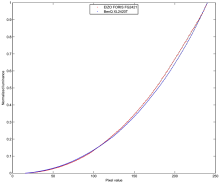
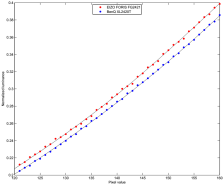
The simple gamma fits are obviously not good enough for inferring anything from the residual errors regarding round-off errors because the residual errors originate rather from the restricted model curve than from local digital noise. In order to make the residual errors represent more the local aspects, the curves have been fitted with cubic splines that have support points at about every 16th pixel value. The very lower and upper regions of the gamma curves are difficult to analyze for several reasons and were therefore excluded from the analysis. Based on the spline fits, the data was normalized (offset and gain). Figure 2 shows the normalized spline fits and Figure 3 is a close-up which reveals the higher noise level for the EIZO.
Residual errors
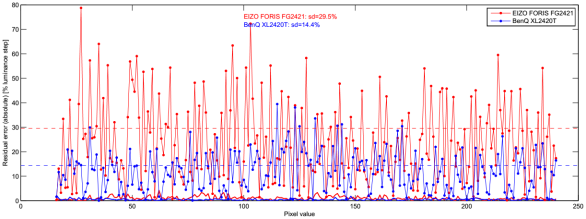
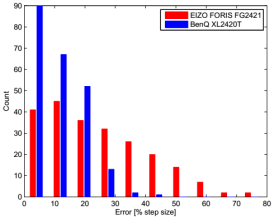
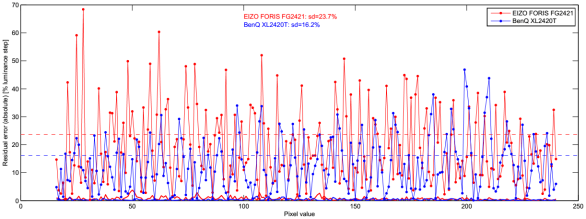
The residual errors of the spline fits were normalized with respect to the step size as inferred from the first derivative of the spline fits. This provides residual errors which are normalized to the nominal local step size. The absolute values of these errors are shown in Figure 4. The standard deviations (sd) of the residual errors differ by roughly a factor of 2 between the two monitors (sd≈30% for the EIZO vs. sd≈15% for the BenQ).
Figure 4 also shows the measurement errors (solid colored lines close to the x axis, small), which are given as estimated standard deviations based on the two measurement repetitions after having removed drift effects. Although the monitors were well warmed up, there is always considerable luminance drift which can easily exceed the measurement errors by one order of magnitude or more. Such kind of drift was modeled by cubic splines with 8 support points over the entire range of pixel values, and the so modeled drift was removed. The remaining measurement errors are negligible compared to the residual errors we are interested in.
Figure 5 shows histograms of the residual errors. Obviously, the error distributions are closer to normal distributions than to uniform distributions, which provides a post-hoc justification for representing the residual errors by their standard deviation instead of the means of the absolute values.
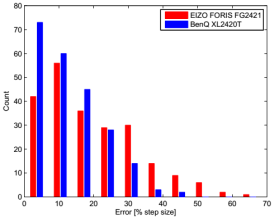
As mentioned earlier, overall better results are to be expected when setting GainG=100% because this should result in virtually one less processing step, i.e., one less source of round-off errors. And indeed, the observed errors are smaller, as can be seen in Figure 6 and Figure 7. Interestingly, the two monitors perform more similar as compared to the GainG=80% case, at least for mid and high pixel values. At low pixel values, however, the EIZO still performs clearly worse than the BenQ.
Discussion
Panel color resolution
Shouldn't the EIZO be performing better than the BenQ for its better panel color resolution (native 8bit over 6bit)?
No, because both monitors apply spatial and/or temporal dithering techniques (FRC) in order to virtually increase color resolution. Of course, the BenQ has to dither a lot more in order to achieve a certain color resolution, but with the measurement method used here, which involves a lot of averaging over space and time, dithering can play to its full potential, at least in principle. Of course, dithering can also be screwed up, for example, by aiming for a too low final bit-resolution or calculating the dithering values at the wrong point in the processing chain, which would also affect the measurements presented here. But this would then not be due to limitations of the dithering principle per se.
White vs. Green
Why not measuring gray levels instead of just Green and, thus, allowing digital noise to average out between channels?
This would have been possible as well, but exactly because of the averaging over the color channels, the effects on the measured luminance would have been smaller and potentially harder to detect. Note that each color channel contributes differently to the combined luminance due to the different maximal luminance of each channel (100% Green is way brighter than 100% Blue). It just seemed better to measure just one channel for finding out what is going on.
High contrast
Isn't it unfair to compare the EIZO to the BenQ in this way, because the EIZO has to cover about 4 times the dynamic range (aka maximal contrast ratio) of the BenQ?
No, at least not as far as round-off errors are concerned, because the analysis is independent of the absolute luminance levels. All that matters is the first derivative of the transfer function, which is used for normalizing the residual errors. Therefore, the overall form and absolute luminance of the transfer function is not important. Likewise, the response curve of the luminance meter would not matter, i.e., the final plots of the normalized residual errors would still look the same if the luminance meter had a non-linear response curve.
Coding efficiency and gamma
How does the coding efficiency depend on gamma?
The best use of the available pixel codes (e.g. 256 for 8bit per per color channel) is made when distributing the codes evenly with respect to the visual sensitivity over the whole luminance range. And the visual sensitivity roughly inverse-scales with luminance, that is, the lower the luminance the higher the sensitivity – at least if it is not too dark or too bright. Normally, a gamma value of around 2.2 is used, which results in a reasonably "uniform" distribution – normally, that is, when the maximal contrast ratio is relatively small as compared to what modern monitors can achieve. Higher contrast ratios would require higher gamma values in order to make step sizes distribute more evenly with respect to sensitivity. On the other hand, a higher gamma value would not really solve the problem of having just too few pixel values for covering a wide dynamic range. In real life, the situation is not so bad actually, as the advertized contrast ratios are hardly ever reached under normal ambient lighting conditions. Moreover, the luminance sensitivity for dark levels is reduced if there is considerable luminance coming from close by.
Smoothness assumption
Doesn't the nature of round-off noise undermine the approach of trying to identify this noise as any deviation from smoothness?
This is indeed a valid point. The terms round-off noise or digital noise are somewhat misleading here, because the noise is not only deterministic (after all, it is digital), which is equivalent to being systematic, but it also can be quite structured with the structure possibly containing enough "smoothness" for being confused with the transfer function. This means that if the noise structure is just smooth or non-local enough, it will be misinterpreted as part of the transfer function and, thus, not be correctly identified as noise. Take, for example, the extreme case of a linear 8bit gamma table that maps the input values [0,1,...255] to the output values [1,2,..,255] (note the missing "0" for the output values). Obviously, there are two input values which need to be mapped to the same output value at some point – which possibly would be around pixel value 128. Even though almost every entry in this table would be tainted with an round-off error, the rounded output values would follow a perfectly smooth function except close to 128. Accordingly, a smooth fit would show some residual errors only for values close to 128 but nowhere else. Thus, most of the digital noise would go undetected and the average noise level would be underestimated.
So it could be that the BenQ accidentally had been operated in a mode where the analysis overlooked a considerable amount of digital noise because of the particular structure of that noise, making the BenQ look much better than the EIZO. But given the plots and histograms shown here, which do not provide enough evidence for supporting such a claim, and also considering all the data not shown here, it seems rather unlikely that the analysis was considerably biased by the structure of the digital noise.
Error homogeneity
How robust is the analysis with respect to the implemented particular gamma function?
This question is to some extent similar to the previous one, that is, there are cases where the analysis can go wrong in that it underestimates the true error. But aside from this, representing the errors by just one value, the standard deviation, assumes that the errors are more or less uniformly distributed across the input value range, meaning that the error amplitude is, in principle, not so much different for dark and bright pixels. This assumption might be violated though, for example, depending on whether non-linear transformations are applied during the pixel processing and where digital noise can kick in (before and/or after such transformations). The data presented here does show some structure here and there, but this is not very pronounced. The structural variations are either too fast (as going through the pixel value range) to be explained by some "adding digital noise before and after some non-linear but well behaved transformation" cause, or the variations are slow but rather small as compared to the overall noise amplitude.
Gamma selection
What was the rationale for choosing these specific gamma values for the measurements?
This was in an attempt to end up with comparable step sizes between the two monitors. That the normalized gamma curves are almost overlapping also helped when comparing the data visually by zooming into the graphs. In the meantime, however, it became clear that there was no need for matching the curves.
Gamma table resolution
The pixel processing in the monitor is not the only source of digital noise. All processing steps at the computer side, like a application of a gamma calibration, can also contribute to the final noise level. However, as far as the controlled measurements presented here are concerned, the pixel values fed to the monitor are free of digital noise, meaning that if the software programmed a pixel value X, it was verified that the monitor also received a pixel value X. This is not so trivial actually, even if no gamma calibration is applied, because there is some pixel processing going on at the operating system's and graphics card's level which is difficult to control. For example, some graphics cards implement a hardware gamma table with a higher color resolution than the resolution provided by the data transmission over the video cable. These cards increase the output resolution virtually by applying dithering techniques. Moreover, at the operating system's level (Windows XP in this case), the entries for the gamma table have to be specified as 16bit values, without actually being clear about how these values are exactly down-scaled to the resolution finally provided by the hardware gamma table. Even if the dithering has been disabled and even if the way of how the operating system and the graphics card are down-scaling the gamma table values has been correctly anticipated by the program, surprising things can happen which lack any reasonable explanation. See Figure 8 for some color resolution measurements for the EIZO and, just for comparison, Figure 9 for the BenQ.

With dithering ON, the luminance changed every two LSB@11bit steps, which corresponds to an effective resolution of 10bit. Surprisingly, with dithering OFF for the HD7750 graphics card, 8 different luminance levels were measured instead of the expected 4. This cannot be explained by any weird round-off artifacts possibly being induced by the gamma table programming. And indeed, with the FirePro V4800 card, everything looked much more like it was expected, except maybe the rather big step size at pixel value 128 which, however, can be explained by round-off errors in the EIZO.

Three observations:
1. The weird behavior observed for the HD7750 graphics card in dithering OFF mode is the same as with the EIZO, which was to be expected.
2. In general, the BenQ measurements seem to be more noisy. This is probably an effect of luminance drift which is just worse for the BenQ even after a long warm-up phase.
3. Although the step sizes with the FirePro card in dithering OFF mode (4th graph) are more uniform than for the EIZO, the 10bit step sizes (dithering ON, 3rd graph) are less uniform. Theoretically, the measured step levels should just reflect a mixture of the adjacent 8bit step levels at ratios of 4:0, 3:1, 2:2, 1:3, and 0:4, like it can be observed with the EIZO. One explanation for this effect could be that the spatial dither pattern used by the FirePro graphics card interferes badly with the dither pattern used in the BenQ monitor. Both, the HD7750 graphics card and the EIZO might apply different dither patterns which do not interfere so much.
