ASUS ROG Swift PG27UCDM

Specifications
| Brand: | ASUS |
|---|---|
| Model: | ROG Swift PG27UCDM |
| Size: | 26.5" |
| Resolution: | 3840x2160 |
| Panel type: | QD-OLED |
| Max. refresh rate: | 240 Hz |
| Panel: | ? (Samsung) |
| Backlight type: | n/a |
| Price (approx.): | USD 1200 |
| Monitor release date: | 2025-01 |
| This review's date: | 2025-12 |
Other Reviews
TFTcentral review of the ASUS ROG Swift PG27UCDM.
RTings.com review of the ASUS ROG Swift PG27UCDM.
At a glance
This is a 4K QD-OLED monitor capable of 240 Hz refresh rate at 10 bpc without signal compression (DSC), albeit only via DisplayPort. Note that 4K doubles the resolution of 2K only in terms of the overall number of pixels, not in terms of pixel density along X and Y. Still, with a pixel density of 166 ppi, the color fringing artifacts caused by the triangular sub-pixel layout of a QD-OLED type of monitor, which were somewhat disturbing on a 27"/2K display, basically disappear (which which is a totally subjective assessment, of course).
OLED technology still comes with the risk of burn-in, which means that too bright content presented for too long can leave visible marks. To reduce this risk, the monitor will only be tested and later used in SDR mode (Standard Dynamic luminance Range) and with the "Uniform Brightness" setting enabled, even though the monitor supports HDR (High Dynamic luminance Range). Moreover, we intend to use the monitor only at max. 120 cd/m2 and without BFI (Black Frame Insertion), all of which should help extending the monitor's usable lifetime. Nevertheless, BFI is still a very welcome option for improving motion clarity. The monitor supports BFI for input signals with 120 Hz, which is where the 240 Hz maximum refresh frequency is put to a use without requiring the PC to actually drive this high frequency.
In the previous reviews of other OLED monitors, a rather high level of color processing was observed. Moreover, the QD-OLED monitor MSI MPG 271QRX exhibited low repeatability in those measurements, even after having filtered out mid- to long-range luminance fluctuations. Because this might be caused by firmware implementation, there was some hope that a different manufacturer, in this case ASUS, would have done a better job. Unfortunately, this was not the case, which speaks for a fundamental problem with OLED panels or how panel manufactures implement the OLED driver electronis. All of the tested panels, which is two QD-OLEDs and one W-OLED, exhibit high color processing noise, and both QD-OLED monitors (one from MSI and now this one from ASUS) exhibit poor repeatability even short-term. Although this is not a deal-breaker, it currently makes W-OLED the preferred choice.
That being said, QD-OLED might have a slight edge over W-OLED, regarding color processing noise, when it comes to presenting gray-scale content. This is because QD-OLED has to use all its three sub-pixels (RGB) for presenting grays, whereas W-OLED uses only its white sub-pixels, meaning that, with W-OLED, there is no averaging between sub-pixels going on, which could otherwise potentially reduce the effect of color processing noise. Obviously, presenting gray-scale content with only white sub-pixels rather than with three colored sub-pixels has the advantage of removing all color fringing, which might be the more important feature anyway.
A QD-OLED monitor might be the wrong choice if it will be used in a bright environment, because it tends to back-scatter light more strongly than W-OLED monitors, thereby reducing the effective maximal contrast. Moreover, ambient light is not back-scattered neutrally but with a purple tint. But in only dimly lit rooms this is considered to be not an issue.
Quirks
- The monitor arrived with firmware version MCM103, which was updated almost immediately to version MCM105 for this review. However, the update process was an ordeal, because updating via an USB stick did not work. The monitor just was not able to read from the stick, even though several different sticks were tried. However, the alternative update method, which requires to run a program on a Windows PC that is connected to the monitor via a USB cable, did work without further problems.
- It is currently unknown how to make the monitor's service menu available.
- DisplayPort 1.4 with UHBR20 (80 Gbps) should be good enough for driving 4K at 120 Hz and 8 bpc without signal compression (DSC). However, out of the box, Windows would always switch to a lower spatial resolution when 120 Hz was selected. This could be only fixed by overwriting the timing parameters with the CVT-RBv2 timing parameters (replacing the CVT-RB timing parameters in the original EDID). See also this Online calculator.
OLED care
OLED monitors are potentially susceptible to burn-in, meaning that static image content can alter pixel performance permanently when presented for a prolonged period of time. Manufacturers implement a number of counter-measures, but, luckily – in the case of the ASUS PG27UCDM –, all of these can be turned off in the on-screen menu. Another counter-measure is to not present bright image content, where "bright" is relative to the maximum luminance in HDR mode, which is around 1'000 cd/m2 for this monitor.Time will tell whether burn-in is still an issue when operating the monitor under more moderate conditions.
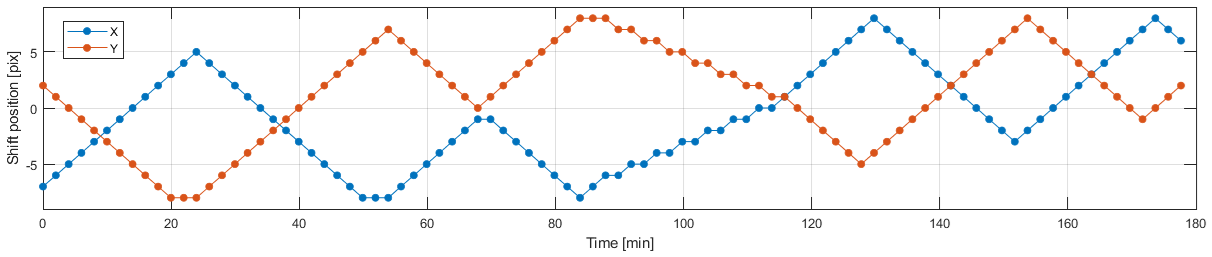
One of the counter-measures implemented by ASUS is called "Screen move". If activated, the entire screen content will be shifted in regular time intervals by one pixel at a time. Besides "Off", there are three "Screen move" options available: "Light", "Middle", and "Strong", where "Middle" is the default setting. These levels differ in how often the content is moved (once per 3 minutes, 2 minutes, or 30 seconds). The motion pattern has some randomness to it, but the motion direction is mostly diagonal and the pattern extends over 16x16 pixels (see Figure 1).
Motion blur reduction
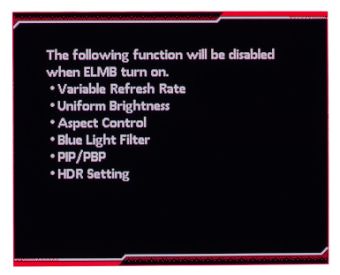
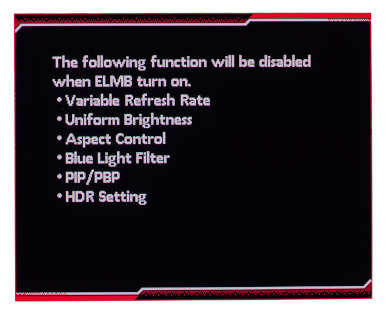
Motion blur reduction, which is called ELMB in the monitor settings (= Extreme Low Motion Blur), is only available at a 120 Hz refresh rate and is implemented through BFI (Black Frame Insertion). The BFI on/off ratio is fixed to 50:50. Neither VRR (Variable Refresh Rate) nor HDR (High Dynamic Range) are available while ELMB is active, and other settings are affected too, without obvious technical reason (see Figure 2).
For the ASUS PG27AQDP, two issues regarding ELMB were observed. The input latency changed over time by as much as one refresh cycle (~8~), and ELMB was disabled whenever the refresh rate was changed back and forth, or the screen resolution was changed, or the PC was rebooted. Not much has changed for the ASUS PG27UCDM, except that the latency is kind of stable now. "Kind of", because the latency can assume one of two possible values, depending on the exact timing conditions when ELMB is activated. Theoretically, the minimal possible latency for the screen center is about 6 ms, whereas the observed latency was either 10 or 14 ms. So, to put it mildly, there is still room for improvement!
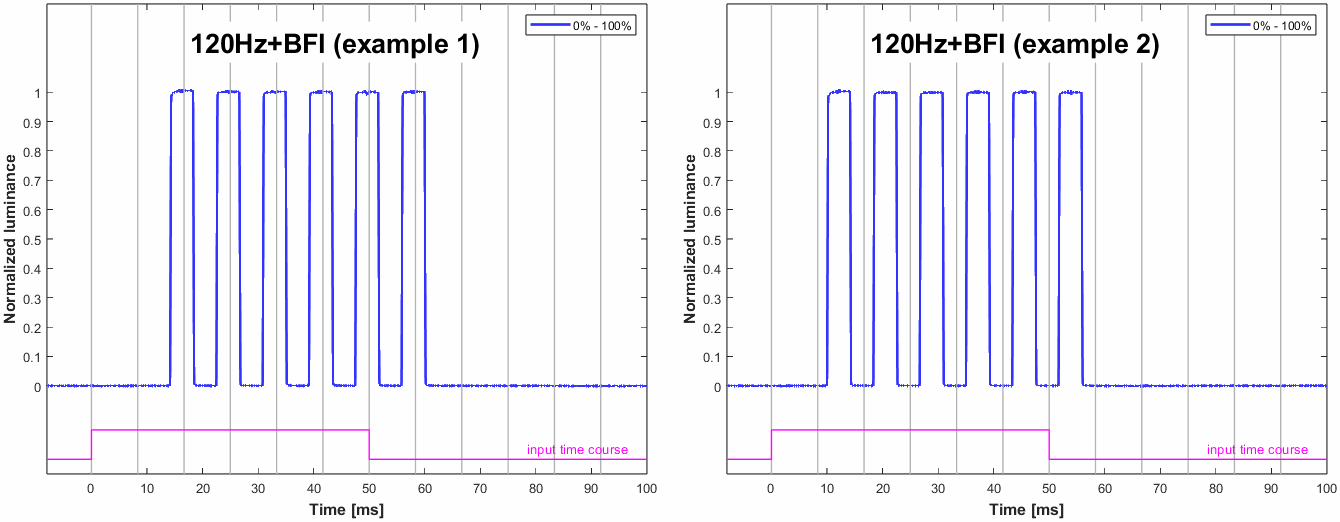
The vertical gray lines mark the times when the OpenGL command sequence SwapBuffers();glFinish(); returns control to the PC program, which is about when the 1st line of a frame is sent out to the monitor. This is also when, for the black to white frame switch, a hardware trigger is updated (pink trace), which is recorded along with the photodiode signal. For this recording, the photodiode was placed at the vertical center of the screen.
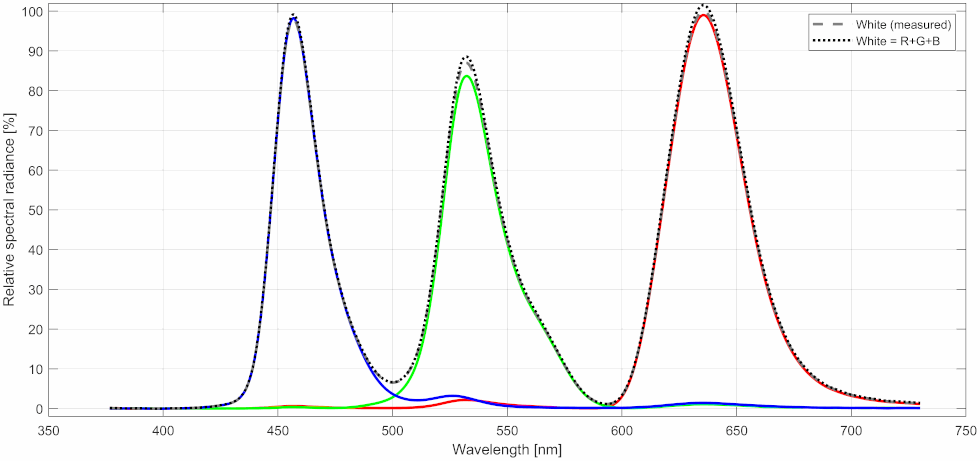
Saturation, White
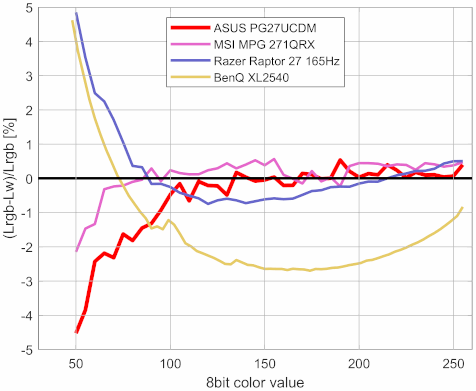
When it comes to color accuracy, one potential problem lies in the interactions between the primary color channels (red, green, blue) when rendering arbitrary colors, including white. Specifically for white, if everything was perfectly accurate, the luminances of the primary colors would add up to LW=LR+LG+LB(=LRGB for short). Deviations from this perfect relationship can be quantified by the (normalized) error Δe=(LRGB−LW) / LRGB (see Figure 4). We can interpret this error also as a saturation error, a de-saturation coefficient, or a cross-talk coefficient. Note that, normally, the according measurements are also sensitive to de-saturation effects caused by the residual background illumination, which becomes overly dominant for dark shades. Besides dark shades being more difficult to measure accurately, this is why dark shades have been excluded from the graphs shown in Figure 4. Obviously, residual background illumination is not an issue with OLED monitors, because they don't have a backlight that could cause residual background illumination.
Normally, the Δe presented here does somewhat correlate with the more familiar dE color accuracy value known from other review websites. The dE2000-value for this monitor is, with dE2000 = 0.323 (averaged over 400 colors), higher than the 0.182 of the MSI MPG 271QRX (QD-OLED panel) and the 0.152 of the Razer Raptor 27 165Hz (IPS panel), and only a little better than the 0.428 of the BenQ XL2540 (TN panel).
Color processing noise
Ideally, the monitor processes incoming pixel values so that the according output luminance follows a smooth transfer function. This processing takes place in the digital domain and aims for some favorable Gamma characteristic while taking other parameters into account, like the Contrast setting, the RGB channel gains, and also spatial or spatio-temporal dithering. One way of quantifying how consistently this is done across the pixel value range, without needing to know the intended Gamma characteristic, is to measure deviations from a smooth transfer function. This means that we do not focus on how well the transfer function is described by a simple Gamma function (aka gamma tracking) but how well the measured data points can be described by a reasonable smooth transfer function. We only measure the green channel here, because it is the brightest of the color channels normally available and, thereby, provides the best signal-to-noise ratio. The lowest (x<16) and the highest pixel values (x>240) are not taken into account here for several technical reasons related to the measurement method and data analysis.
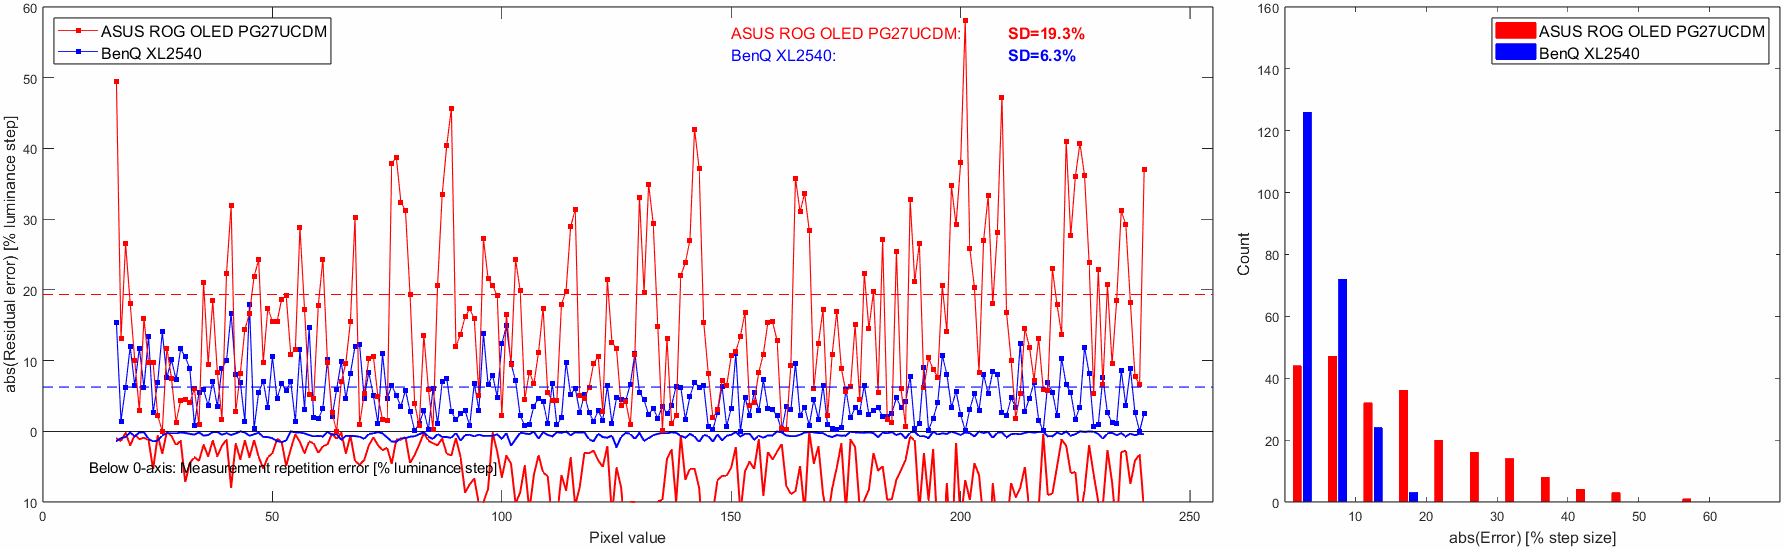
Figure 5 shows the results for the ASUS PG27UCDM and, for comparison, the BenQ XL2540. For this comparison, the ASUS was operated at 8 bpc in order to match the capabilities of the BenQ which accepts only 8 bpc inputs. Clearly, the ASUS is doing much worse in this test than the BenQ (SD=19.3% vs. SD=6.3%; smaller standard deviations are better). Unfortunately, the measurements are contaminated by the low luminance stability the ASUS shows over time (see the curve below the x-axis in Figure 5), which seems to be a particular issue with QD-OLED monitors (see also MSI MPG 271QRX#Color_processing_noise).
By the way, this measure should closely correspond to the Gradient score given in the RTings.com review, which is 9.8 of the possible 10.0 for this monitor.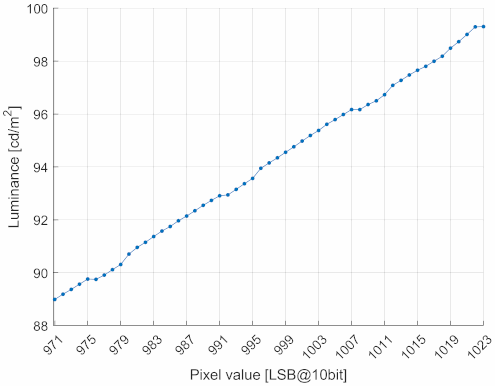
Obviously, this is not at all in agreement with our findings. It is probably because RTings.com scores the gradient subjectively and with a rather poor score resolution. The vast majority of the monitors tested by RTings.com are scoring between 9.5 and 9.9, which is only 5 steps for basically the entire relevant range and, therefore, does not allow for a very refined evaluation.
Although the ASUS, being an HDR-capable monitor, allows input signals with 10 bpc color depth, switching to 10 bpc does not seem to have an effect on color processing noise (not shown here), but the low luminance stability makes it difficult to make conclusive measurements. There is no improvement expected anyway, which was also shown in previous reviews where 8 bpc was compared to 10 bpc. To be clear, this was always about color processing noise sampled at 8 bpc pixel value steps, i.e., the software was not made aware whether the graphics card was transmitting these values with a color resolution of 8 bpc or 10 bpc. This is somewhat different than looking at the transfer function at full 10 bpc resolution, i.e., where the application is 10 bpc-capable and will step through the pixel values with 10 bpc resolution steps. Figure 6 shows such measurement of the very upper part of the transfer function, for just the Green channel. The artifacts are reproducible and show systematic errors of full 10 bpc steps, which are difficult to explain by just a limited precision in the internal color processing calculations.
Settling behavior

The following measurements were made with a photo diode PDA36A (Thorlabs), the gain of which was set to 60 dB resulting in a bandwidth of 37.5 kHz and a minimal rise/fall time (10%-90%) of about 9 µs. The photodiode was placed at 4.5 cm from the screen surface at a straight angle. Ambient light was kept from the measured area by a rubber sleeve of 3 cm diameter which also limited the maximal incident angle to about ±20°.
The vertical extent of the measured screen area was not only limited by the rubber sleeve but also by the stimulus being a horizontal stripe covering just 5% of the screen height. Note that the OLED pixels are updated sequentially from the top of the screen to the bottom, which results in different delays for the luminance curves, depending on the vertical measurement position. By limiting the measurement to only 5% of the full vertical screen size, the smear effect caused by averaging over differently delayed luminance signals is limited to a well defined value. For example, at a refresh frequency of 120 Hz, the screen is updated within around 8 ms, so that a theoretically instant luminance onset on a single-pixel level would result in a measured luminance curve with a 0% to 100% transition ramp over a duration of 5%·8 ms = 0.4 ms. This smear effect is what limits the bandwidth of the measurement and determines, for example, the shortest rise/fall times that can be accurately measured this way. Normally, i.e., when measuring LCDs, this is not the overall-limiting factor, because LCD pixels switch considerably slower anyway. But with OLEDs, where the luminance onset – on the single-pixel level – can indeed be assumed to be instantaneous, this smear effect is the overall-limiting factor.
For more detailed information on the measurement method and the presentation of the results, see Flicker-free settling.
Settling curves
Figure 7 shows the luminance signal over time for the horizontal stripe being switched from black to white and back. Since the pixels in OLED monitors respond virtually instantaneously, the exact shape of the luminance transition is of minor interest here. Nevertheless, Figure 7 still provides some noteworthy insights.
- The latency (or input lag) is as short as can be expected, namely about half the duration of a refresh cycle. Note that these measurements were taken at the screen center; therefore, and assuming that the pixels are updated at the very time they are received, half of the frame had to be received when the update process arrives at the vertical screen center where the photodiode was placed, which is why latency was measured to be half a refresh cycle.
- The amplitude for the first refresh cycle after the switch is higher than for later refresh cycles, as if the monitor was using overdrive. This is only the case for specific luminance values though, which will be shown in the Settling matrix measurements section.
- Each refresh cycle ends (or – depending on how you look at it – starts) with a very brief low-pulse. This is typical for OLED monitors and reflects a pixel reset phase that is part of the pixel refresh procedure. We cannot infer any precise per-pixel pulse timing from our simple measurements here, because the photodiode lumps together several pixel lines into one signal, thereby smearing out such short time events (as explained above). But the smearing is why the relative pulse amplitude is seemingly higher for 240 Hz than for 120 Hz; at double the refresh rate, the recorded pixel lines are simply updated twice as fast, which results in less smearing and, thus, in a less washed-out pulse.
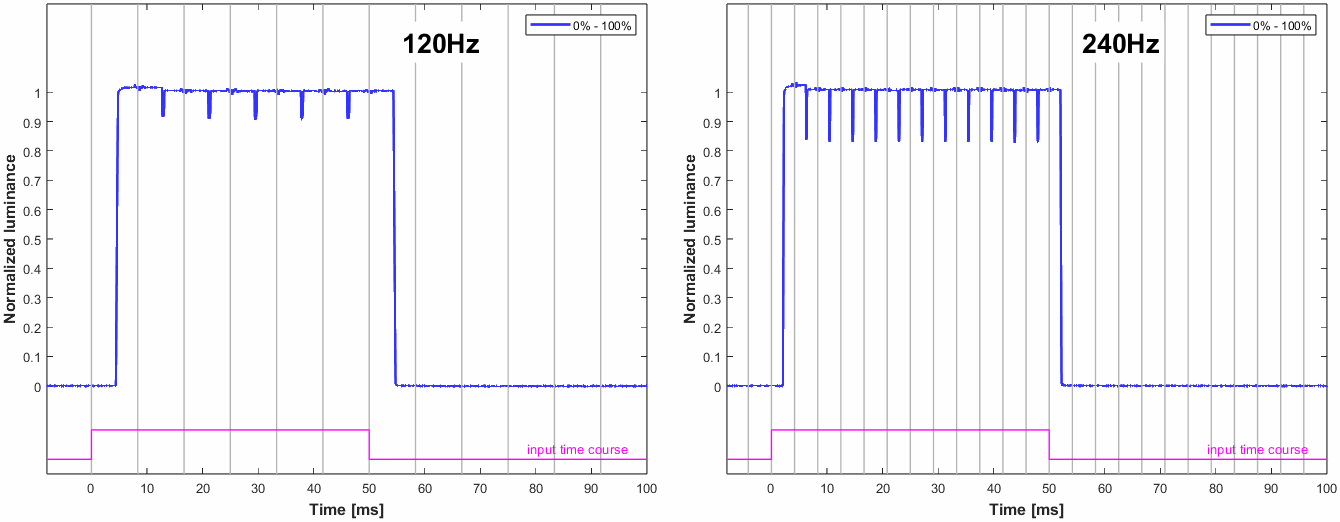
The vertical gray lines mark the times when the OpenGL command sequence SwapBuffers();glFinish(); returns control to the PC program, which is about when the 1st line of a frame is sent out to the monitor. This is also when, for the black to white frame switch, a hardware trigger is updated (pink trace), which is recorded along with the photodiode signal. For this recording, the photodiode was placed at the vertical center of the screen.
Settling matrix measurements
The metrics typically presented in this section, such as settling times, fall/rise times, and similar measures, are intended to characterize the shape of the pixel response curves. However, for OLED monitors with their ultra-fast pixel response time, most of these measures have become largely irrelevant. Those that remain useful may have to be tweaked in order to account for new signal features, such as the pixel reset pulse, which otherwise would contaminate the measurements.
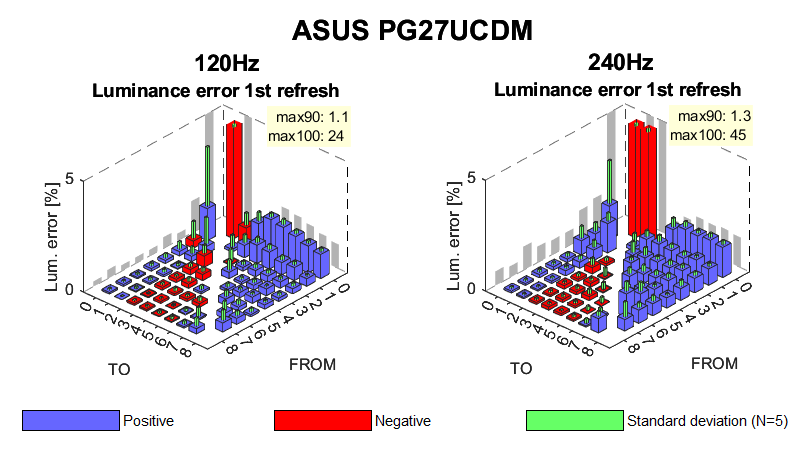
Note the z-axis has been clipped at 5% to improve the scale for the values of interest.
A "positive" error corresponds to the luminance being higher in the first refresh cycle than in later refresh cycles, no matter whether the FROM pixel value was larger or smaller than the TO pixel value.
Figure 7, in the previous section, suggests that overshoot – or, alternatively, the average luminance error in the first refresh cycle after a pixel level change – might still be worth looking at. Since luminance remains mostly constant throughout a refresh cycle, the average luminance is the measurement of choice, provided that time intervals potentially affected by the limitations of the measurement method are excluded. To this end, the pixel reset pulse was excluded from averaging.
To assess the aforementioned luminance error, the methods described in Flicker-free settling were used, with some modifications: the photodiode gain was set to 60 dB (instead of 70 dB), a low-pass filter frequency of 4 kHz (instead of 70 Hz) was applied to preserve the features of the fast OLED pixel response, and the signal averaging was limited to a time interval that is free of potentially contaminated samples, as outlined above. Note that, with these procedural adjustments, the signal bandwidth is ultimately constrained by the width of the measured stripe on the screen.
Figure 8 shows the luminance errors for the first refresh cycle following a pixel level change, for 120 Hz and 240 Hz. The large negative errors (red bars, clipped at 5%) are of little relevance because they are for switching from black to very dark. The other errors are reasonably low.
Color spectra