Luminance (in)stability in OLED monitors
Topic
It is well known that OLED monitors down-regulate displayed luminance if, otherwise, the overall average luminance in the display would exceed a limit that cannot be handled by the monitor on the long run. However, luminance variation caused by such limitation shall not be discussed here. Instead, this discussion is about luminance stability when the monitor is operated in "uniform brightness" mode, where the brightness is limited beforehand, in the monitor, such that the monitor never needs to down-regulate, irrespective of what is displayed. The brightness is even further reduced, via the monitor's Brightness setting, to a value well below the specified maximum for the "uniform brightness" mode.
One major difference between LCD and OLED technology is that, in LCD monitors (at least in models without local dimming), the light is coming from a backlight of constant brightness, while the pixels just act as individual light valves which control how much of this backlight can pass; in OLED monitors, on the other hand, the light is generated directly by the pixels. The electrical energy required to produce the light is substantial in both cases, but in OLED monitors it is directly coupled to the image content and, therefore, can vary a lot and rapidly, which is much more difficult to deal with than just powering a constant backlight. The pixels in LCD monitors do not consume a lot of electrical energy and are therefore easier to drive. Even though OLED pixels are designed to control their current independent of the shared supply, the energy has still to be routed efficiently to the pixels, and the shared supply has still to be actively controlled for keeping it reasonably stable despite rapidly shifting overall power demands. The inherent problems are similar to those encountered in power-grids, where a light bulb can flicker for two reasons: either because the transmission line is not strong enough to handle changing power demands without considerable voltage drops, or because the power plant is too slow in following the changing power demands. So, here, we ask how much the light bulb flickers, so to speak.
The practical relevance of potentially unstable pixel luminance totally depends on the application, that is, how fast and to what extent the (intended) image luminance is changing, and how stable the luminance of a potential target stimulus has to be.
Luminance measurement method
Luminance measurements were taken using a photodiode (OSRAM SFH2240-A01, photo-sensitive area: 2.65x2.65 mm) which was connected to a micro-controller (RaspberryPi RP2350) via a trans-impedance amplifier. The RP2350 offers a 12bit analog-digital converter which was operated at &tickapprox;385 ksps. However, data was down-sampled to 20 kHz at 16bit before making it available to the PC. The photodiode, which was housed in a small enclosure together with the other electronics, was placed over a 5x5 mm target stimulus at the screen center, at a distance of about 2.5 mm from the screen surface.
A thin layer of foam rubber applied to the enclosure's surface, surrounding the enclosure's photodiode cutout, reliably shadowed ambient light. Moreover, the target stimulus was always drawn on a black 35x35 mm square, thereby creating a local background that prevented light emitted by the global background pattern from bleeding into the target area via the mechanical screen structure covering the pixels.
Although the used photodiode is somewhat Vλ-corrected, this correction is far from perfect. Moreover, the setup did not include an optical lens which could have restricted the otherwise relatively wide angular reception profile, which makes the setup more sensitive to different angular emission characteristics of the different monitor technologies (e.g., TN vs. OLED). Therefore, the measured signal amplitude for a calibrated D65 white target with 100 cd/m2 still depended on the monitor under test. The signal amplitude for the 5x5 mm target varied between 23%FSR and 33%FSR, and it was about 30% higher for the bigger 35x35 mm target used in one of the tests.
The stimulus presentation and final luminance sampling followed a 4 Hz clock. In essence, each 4 Hz cycle started with updating the displayed image, whether the image content actually changed or not. Photodiode samples that happened to fall in this sampling cycle were averaged while ignoring samples that could potentially be contaminated by the content of the previous or the next image, assuming an predefined image settling time that depended on the monitor technology (e.g., a generous 10 ms for OLED monitors, or 40 ms for the TN and IPS monitors). The monitors were operated at a 120 Hz refresh rate.
Side note: Originally, an industrial camera (IDS UI-3360CP-NIR, 2048x1088 pixels, 2/3" monochrome CMOS sensor) was used for taking the luminance measurements, with the 5x5 mm target stimulus filling an ROI of 1024x1024 camera pixels. However, the final measurement noise with this setup was about one order of magnitude worse than with the photodiode (SD=0.072% vs 0.0054%, in the best-case scenario test with the best monitor), which provided too little headroom for differentiating between the monitors in the less demanding tests.
Test stimuli
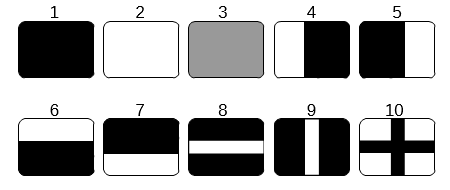
There were several tests, each with its specific stimulus configuration comprising a full screen background with the measured target in the screen center. The background either changed between several static patterns (see Figure 1), or it was just all black or all mid-gray throughout, or it was slowly ramped up from black to white and then back down from white to black. The measured target was either small or big (5x5 or 35x35 mm), and the target luminance could be constant over time or changing.
Test protocol
The entire test sequence was run automatically, but the single tests were otherwise independent. Before each test, a quick gamma curve was measured for inferring the pixel values needed for specific luminance levels.
For each of the 6 tests, 5 repetitions of 2 to 4 minute long sweeps were measured. If the stimulus sequence was randomized within a sweep, it was exactly the same randomization for all sweep repetitions (and for all monitors). For example, if the background pattern was changed randomly from time to time, this random sequence of background patterns and the duration of each pattern was kept the same for all sweeps and all monitors. Before each sweep, a black screen was presented for 10 seconds, which was supposed to somewhat reset the state of the screen pixels and the monitor control electronics. For a single monitor, the data collection took about 95 minutes.
Analysis
Very slow luminance changes are not of interest here, which is why luminance drift was removed from each sweep. The drift was modeled by a smoothing quadratic spline with support points about every 60 s. For a 2-minute sweep, for example, this resulted in 4 coefficients (per sweep), including the coefficients for the spline boundary conditions for the sweep start and end. Because such drift model is too flexible for preserving the systematic luminance changes that are of interest in the BgRamp+TgtMaxSmall test (see below), the spline-based drift model was replaced, for this specific test, by a linear drift model (i.e., 2 coefficients per sweep).
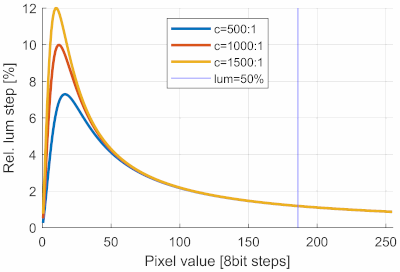
The blue vertical line indicates where the luminance reaches 50% of the maximum luminance. All tests use target luminances higher than 50%, for which the relative luminance step sizes are about 1% and independent of the monitor's white contrast.
Also of no interest are the absolute luminance levels, which is why the luminance error is expressed as relative luminance error, defined as the difference between the measured and the expected luminance, divided by the expected luminance. The expected luminance was defined as the average luminance across all measurements taken within a sweep for a given target luminance value. This error definition closely reflects what is also perceptually relevant; a 1% relative luminance error is perceptually as large for dark stimuli as it is for bright stimuli – give or take –, even though the corresponding absolute luminance errors differ.
For the quantitative evaluation of the measured relative luminance errors, a comparison with the relative luminance step size based on a gamma transfer function might be helpful. Unfortunately, this step size depends on the assumed gamma value, the white-contrast, and the specific pixel value. Figure 2 shows step size curves for gamma=2.2 and for three different contrast levels. In the tests described here, which mostly use a 100%-white target or at least a target with a luminance above 50% of maximum white, an 8 bit step corresponds to a relative step size of roundabout 1%. A uniform distribution of an according luminance error would have a standard deviation (SD) of 1%/sqrt(12) ≈ 0.3%. This means that the relative luminance error resulting just from the 8 bit quantization would be 0.3%. However, this is a theoretical value that does not include the additional round-off noise introduced by the color processing in the monitor. However, since halfway decent monitors exhibit far less color processing noise by comparison, the 0.3% value retains its significance as a reference.
Results overview
| Bg0 + TgtMaxSmall |
BgMid + TgtMaxSmall |
BgVar + TgtMaxSmall |
BgRamp + TgtMaxSmall |
Bg0 + TgtVarSmall |
Bg0 + TgtVarBig | |
|---|---|---|---|---|---|---|
| BenQ XL2540 (TN) |
0.028% (±0.0020) |
0.015% (±0.0021) |
0.085% (±0.00077) |
0.056% (±0.0011) |
0.027% (±0.0030) |
0.023% (±0.0024) |
| ASUS XG27AQ (IPS) |
0.014% (±0.00055) |
0.015% (±0.00052) |
0.050% (±0.00026) |
0.034% (±0.0032) |
0.015% (±0.00044) |
0.015% (±0.00046) |
| Razer Raptor 27 165Hz (IPS) |
0.0054% (±0.00020) |
0.0059% (±0.00028) |
0.041% (±0.000068) |
0.019% (±0.00064) |
0.011% (±0.00019) |
0.011% (±0.00029) |
| ASUS PG27AQDP (W-OLED) |
0.017% (±0.0012) |
0.018% (±0.00072) |
0.17% (±0.00093) |
0.11% (±0.0047) |
0.022% (±0.00045) |
0.024% (±0.00093) |
| ASUS PG27UCDM (QD-OLED) |
0.075% (±0.0095) |
0.046% (±0.0029) |
2.2% (±0.013) |
2.7% (±0.013) |
0.079% (±0.0055) |
0.10% (±0.016) |
| MSI 271QRX (QD-OLED) |
0.066% (±0.0085) |
0.037% (±0.0084) |
0.31% (±0.0060) |
0.79% (±0.033) |
0.066% (±0.0076) |
0.066% (±0.0076) |
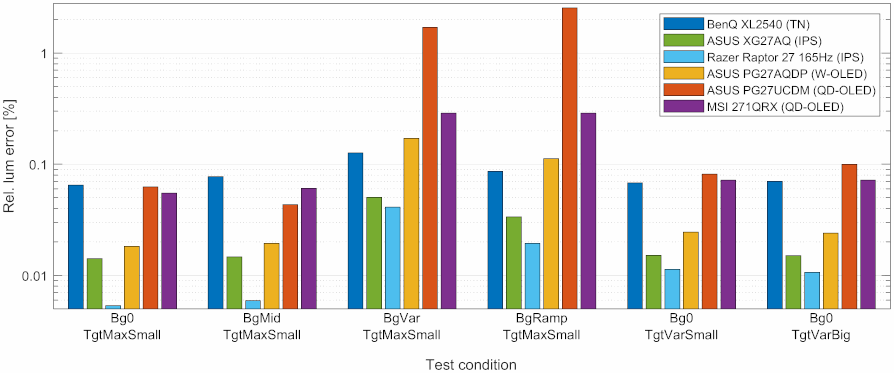
Table 1 and Figure 3 show the relative luminance errors in terms of standard deviations (SDs) for the test conditions explained further below. Note that for the MSI 271QRX monitor (violet bars) the small target was actually always replaced by the big target, which – the big target – was otherwise only used in the last test condition (Bg0+TgtVarBig). This was necessary because the pixel shift (an OLED-care option) could not be disabled for this monitor and prevented the small target from being measured with sufficient consistency.
The TN and an IPS monitors were mainly included for reference, whereas the main focus lies on the comparison of the three OLED monitors, the difference between W-OLED and QD-OLED in particular.
Notice that the Y axis in Figure 3 is log-scaled, so the performance differences are actually bigger than they appear in the figure.
Test scenarios
Best-case (baseline)
Test: Bg0+TgtMaxSmall and BgMid+TgtMaxSmall.
Obviously, the lowest errors are expected when the screen image remains completely unchanged. One cannot be sure though whether a black background is really optimal here, because a black screen puts the monitor's control circuit at the lower end of its operating range, where the circuit might be working less optimal than closer to the center of its operating range. Therefore, a mid-gray background might yield better results.
The Razer monitor shows, with relErr=0.0054% in the BgMid+TgtMaxSmall condition, the best result, obviously also providing an upper limit for the photodiode measurement noise, at least for this luminance level, i.e., at 100 cd/m2. Further measurements (not shown here) suggest that this value might reflect, at least to a considerable fraction, photodiode measurement noise rather than monitor luminance noise. Anyway, given that all other results are much higher than relErr=0.005%, those other results are largely unaffected by measurement noise.
The big performance difference of the two IPS monitors (Razer with 0.0054% vs. ASUS with 0.014% – almost a factor of 3) shows how much the particular implementation can play a role. Although both monitors are IPS monitors, they use panels from different manufacturers (Razer: Innolux vs. ASUS: AUO).
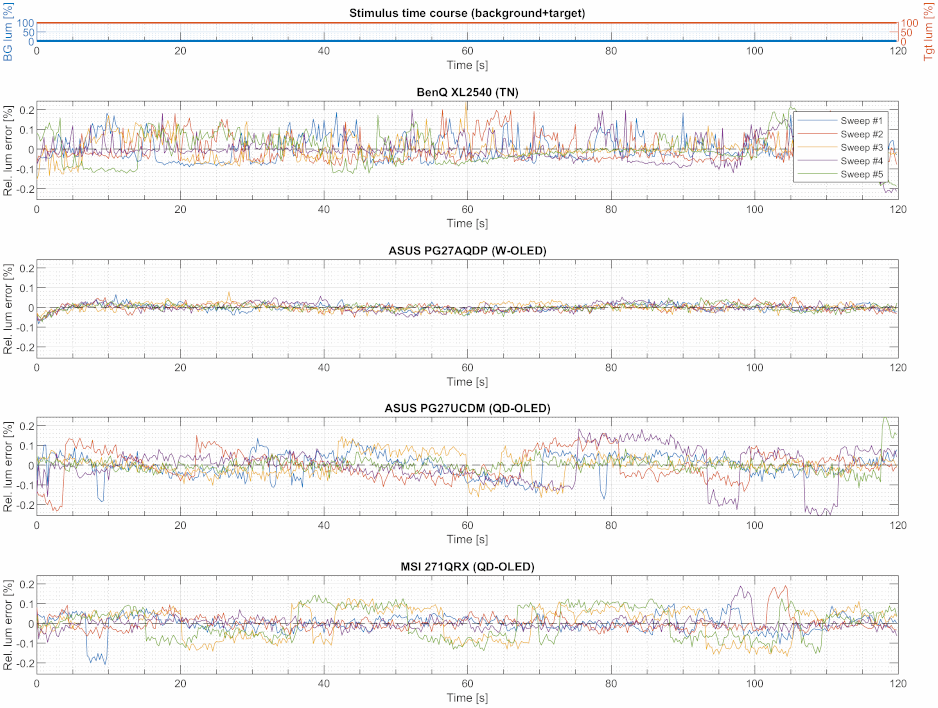
It is noteworthy that the major part of the noise exhibited by the worst-performing monitors (i.e., the TN and both QD-OLED monitors) originates from low-frequency abrupt luminance changes, especially for the two QD-OLED monitors (see Figure 4).
Effect of background pattern
Test: BgVar+TgtMaxSmall.
Whereas the previous test was about the best-case scenario, this test is more about the worst-case scenario. How is the target stimulus luminance modulated by the background pattern and average luminance? The effect of the background on the target luminance might not only driven by different overall average luminances but also where on the screen, with respect to the target position, either dark or bright regions are presented. There are many potential factors at play, but the goal is not to identify and isolate them but to create a worst-case scenario, which gives each of these factors a fair chance to come into effect. This is done by presenting different patterns (see Figure 1) in random order and for random duration, all the while the target stimulus at the screen center remains the same throughout. Importantly, this includes scenarios where the average luminance will change a lot within a short time, allowing for potential settling effects of the monitor's control circuit to become relevant. In fact, the pattern sequence includes more full black and full white screens than other patterns for making more extreme changes in the overall average luminance even more likely.
Figure 5 (and Figure 6 for a zoomed-in version) shows the traces for the OLED monitors.
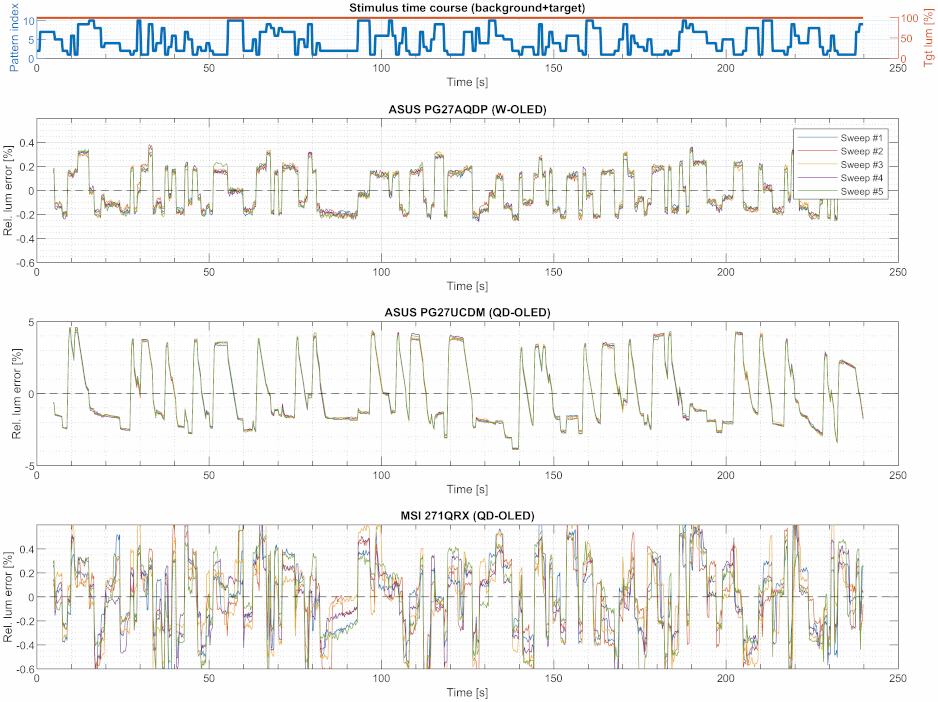
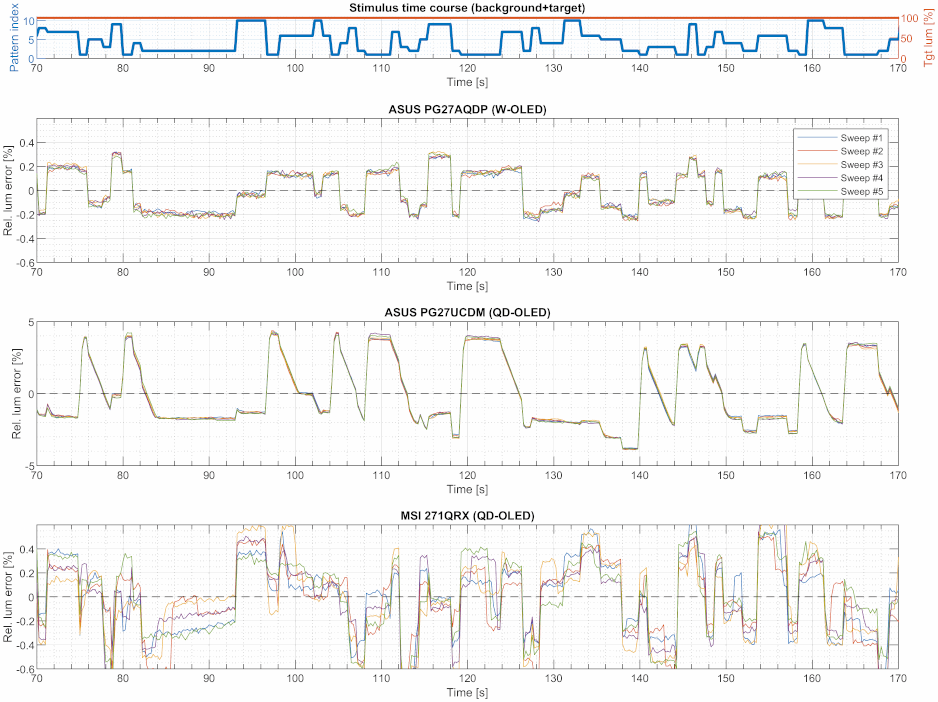
Notice that the Y axes scalings in the figure differ by an order of magnitude. This is how far off the ASUS QD-OLED is in this test compared to the other two OLED monitors. Also notice that the stimulus time course for the background (blue curve in the top panel) indicates the background pattern and not the background pattern's overall luminance (at least not directly). For the pattern indices, see Figure 1. Therefore, there is no obvious low/high correspondence to be expected between this blue curve and the traces. For judging the magnitude of the Y values, be reminded that an 8 bit step corresponds to a relative step size of roundabout 1%, meaning that, for the ASUS QD-OLED monitor, the dominant modulation amplitude is in the order of several 8 bit steps – not great!
There is little low/high correspondence between the traces of the different monitors to begin with, but the ASUS QD-OLED in particular exhibits a pronounced dynamic settling behavior whenever the relative luminance error (and, thus, the luminance) changes from a higher to a lower level, which becomes clearer when zooming in (see Figure 6). This settling behavior is even uni-directional. Whatever the explanation might be, this is not specific to QD-OLED technology, as the MSI QD-OLED monitor does not show this behavior at all.
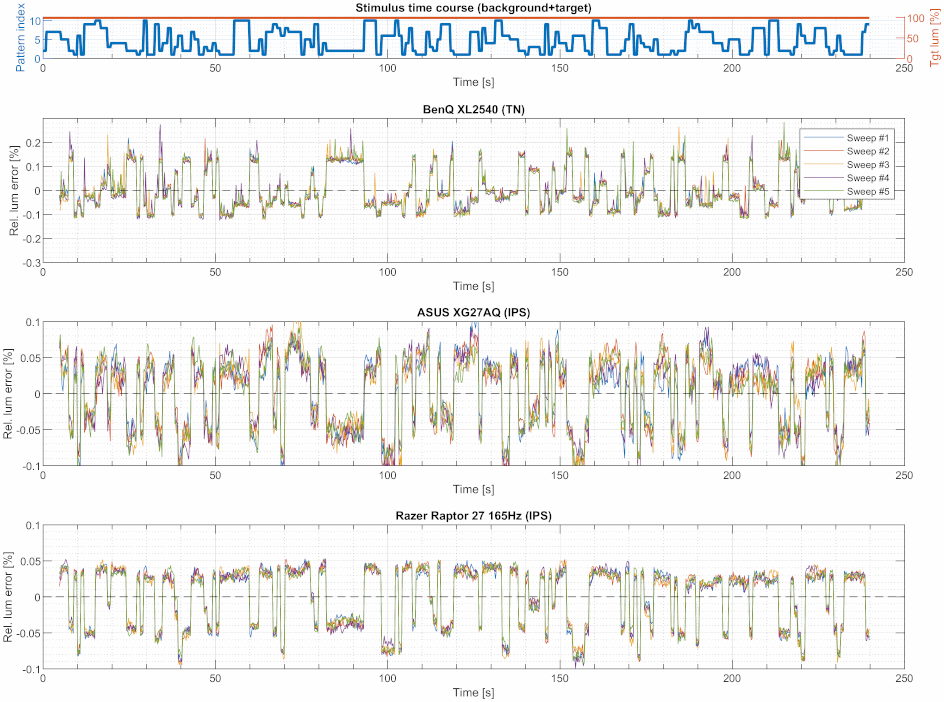
Figure 7) shows the error patterns for non-OLED monitors, which look rather similar to those of the OLED monitors, albeit the error levels are mostly lower. That the patterns look similar does not necessarily mean that they are caused by the same mechanism. At least for the non-OLED monitors, it seems very unlikely that the observed luminance modulation is reflecting a modulation of the LED backlight, which operates very independently of the image content. Although this is clearly different in OLED monitors, as explained in the introduction, it is just an assumption that the luminance modulation observed for OLED monitors is predominantly caused by the global current control circuit which, in turn, is affected by the overall average luminance. To isolate average luminance effects from background pattern effects, the next test is better suited.
Effect of average luminance
Test: BgRamp+TgtMaxSmall.
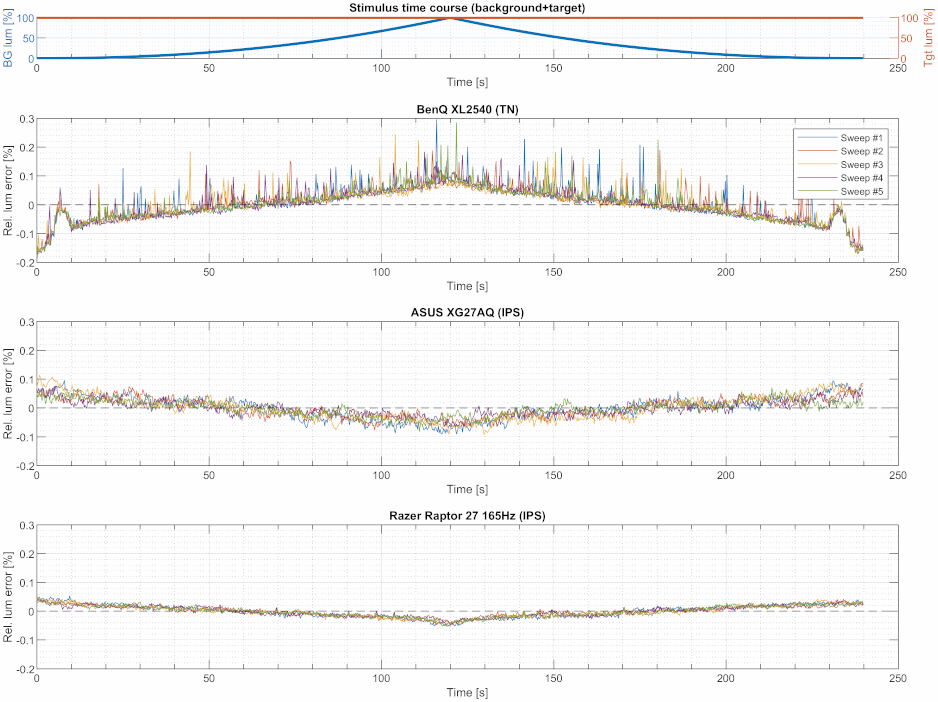
This test probes the monitor's behavior for different overall average luminances without potentially contaminating the results by additional background pattern effects as is the case with the previous BgVar+TgtMaxSmall test. Moreover, this test covers the range of average luminance exhaustively, which can reveal different operating regimes of the monitor's control circuit. To do so, the entire background (excluding the target region) is slowly changed from black to full white and back. Having both, the up-ramp and the down-ramp, allows to reveal potentially interesting symmetry effects. Note that the measured target is a full white stimulus, which might be considered the best-case scenario as far as relative luminance errors go if, for example, the absolute error is more or less independent of the luminance level.
br/>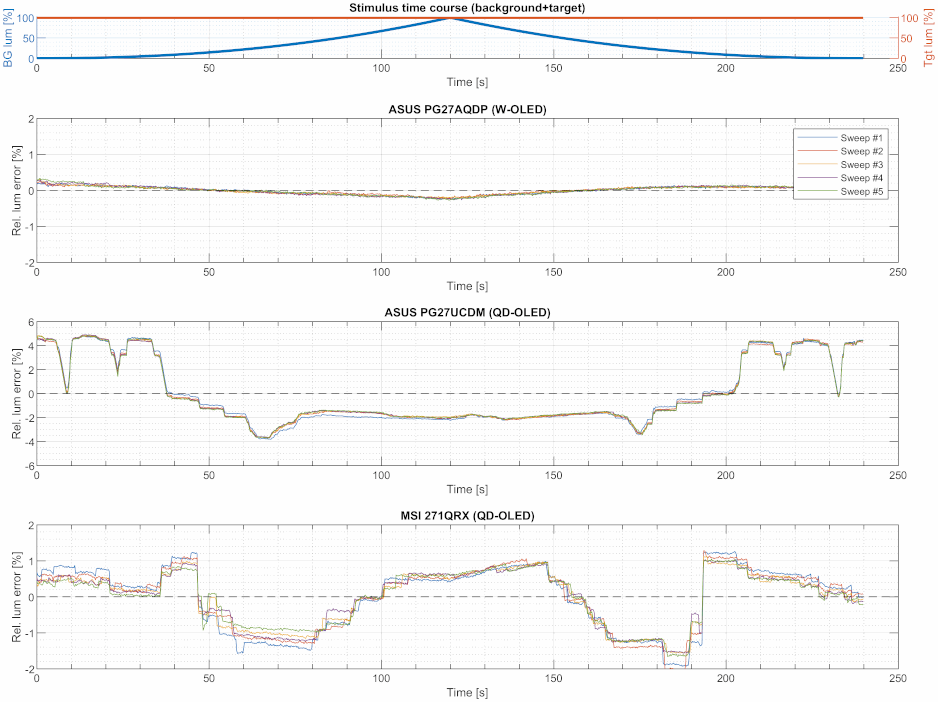
Figure 8 shows the traces for the OLED monitors. The W-OLED monitor stands out positively as it shows a smooth modulation similar to the non-OLED monitors albeit at a somewhat higher error level (see Figure 9). The ASUS QD-OLED is the worst, although mostly because of the behavior at average luminances below ≈40% (which corresponds to 40 cd/m2 under the test conditions used here). The behavior of the MSI monitor seems not as reproducible as with the other monitors, neither absolutely nor in terns of symmetry between the up- and the down-ramp. This might indicate a high susceptibility to temperature fluctuations. However, these fluctuations make only the minor part of the error which is still smaller than for the ASUS QD-OLED monitor, despite these fluctuations.
Also the non-OLED monitors show a modulation with the background luminance (Figure 9). However, this modulation might originate from more local and spatial interactions between target and background regions rather than from the change of overall average luminance. If such interaction exists, the associated luminance errors are likely modulated by the local background luminance levels rather than some overall background luminance. This hypothesis is supported by comparing error levels between different background patterns while taking also the level of the respective average luminances into account. The simple error vs. average luminance relationship observed for non-OLED monitors in the ramp test makes such dissociation between average luminance effects and background pattern effects relatively easy, in contrast to the OLED monitors (at least the QD-OLED monitors), where both tests, the ramp test and the background pattern test, show complex patterns. Be it as it may, the error magnitudes and patterns are of more interest here, rather than the exact cause of these errors.
Speaking of patterns, the TN monitor stands out insofar as its traces are very spiky. Moreover, the traces are upside-down when compared to other monitor types, which might reflect that TN panels are usually "normally black" (i.e., the pixel get brighter as pixel voltage increases), whereas IPS panels are "normally white".
Target luminance repeatability
Test: Bg0+TgtVarSmall.
The tests described so far were designed to probe the modulation effect of the background on a constant target stimulus, whereas this test is looking at the luminance stability or repeatability within a sequence of different target luminances. Since only the small target on an always black background was presented in this test, the overall average luminance did hardly change, thereby going easy on the power control circuit. This test aims at revealing potential memory effects at the pixel level (driver electronics and mechanical pixel structure).
The stimulus is similar to what is normally used for measuring luminance settling time and overshoot, where the measured target's luminance is switched between predefined luminance levels. But those tests are measuring short-term settling effects and use the settled luminance state after each individual luminance switch as a reference. Here, in contrast, it is about how stable or reproducible these settled luminance states are in different temporal contexts. To this end, the target stimulus is changed between different luminance levels and for random time intervals. For the sake of high SNR, only luminance levels above 50% are probed.
The black background is assumed to be the worst-case scenario in the context of this test, being well aware that this might actually not be the case. However, the first test of the test battery (i.e., Bg0+TgtMaxSmall vs. BgMid+TgtMaxSmall, see above) and the ramp test (i.e., BgRamp+TgtMaxSmall) provide some evidence that a black background is at least not exceptionally beneficial when it comes to luminance errors.
The results for this test are presented in the same form as above, i.e., as relative errors over time, even though this is somewhat misleading. Abrupt changes in relative errors as well as the high variance of relative errors across measurement sweeps are merely artifacts of the form of presentation. The different target luminance levels require accordingly different reference luminances for computing relative errors. Therefore, not only time is changing when going from one target luminance to the next but also the reference value used for computing the respective relative errors, thereby introducing potential steps in the traces. Moreover, small differences between the sweeps can translate to apparently lower repeatability between measurement sweeps. Yet another aspect concerns the error magnitudes. Just be reminded that, if the absolute errors happen to not scale with the luminance level, lower luminance levels will come with higher relative errors just because lower luminance levels mean lower reference values the absolute errors are related to. This is an intended effect, because relative errors are just the better measure when it comes to the perceptual impact of, as explained in the Analysis section. All these issues make the interpretation of the graphs rather difficult.
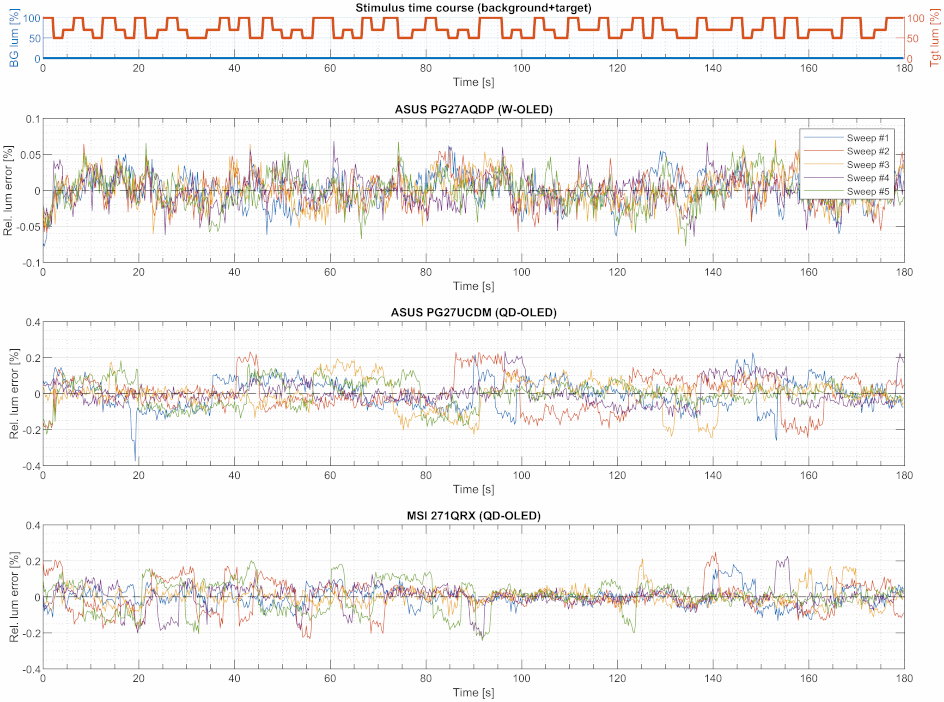
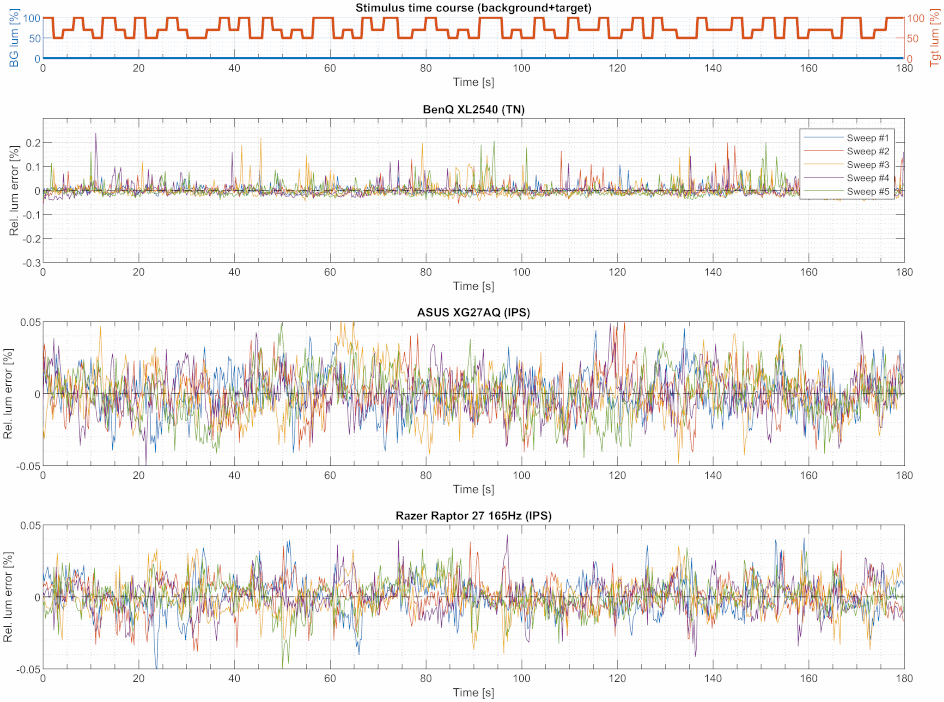
That being said, Figure 10 and Figure 11 show the results for the OLED and non-OLED monitors respectively. The patterns exhibited by the QD-LED monitors set them apart from the rest of the other monitors by showing much more non-random components. Due to the issues just explained, it is hard to extract anything more from this data than the total noise levels. And the noise levels are actually not too far from the levels observed for the best-case scenario (Bg0+TgtMaxSmall, see Figure 3), which is a good thing. The difference between these tests could actually be just the result of the relative errors being inversely scaled with the target luminance, which is equivalent to saying that the absolute error does not depend on the target luminance level. This is not necessarily the case but it could be. The only exception is the Razer monitor (IPS), which shows a significant lower error in the best-case scenario (max. white target), even though it still shows the lowest error of all the tested monitors also in this less favorable scenario (variable luminance target).
Effect of local pixel neighborhood
Test: Bg0+TgtVarBig.
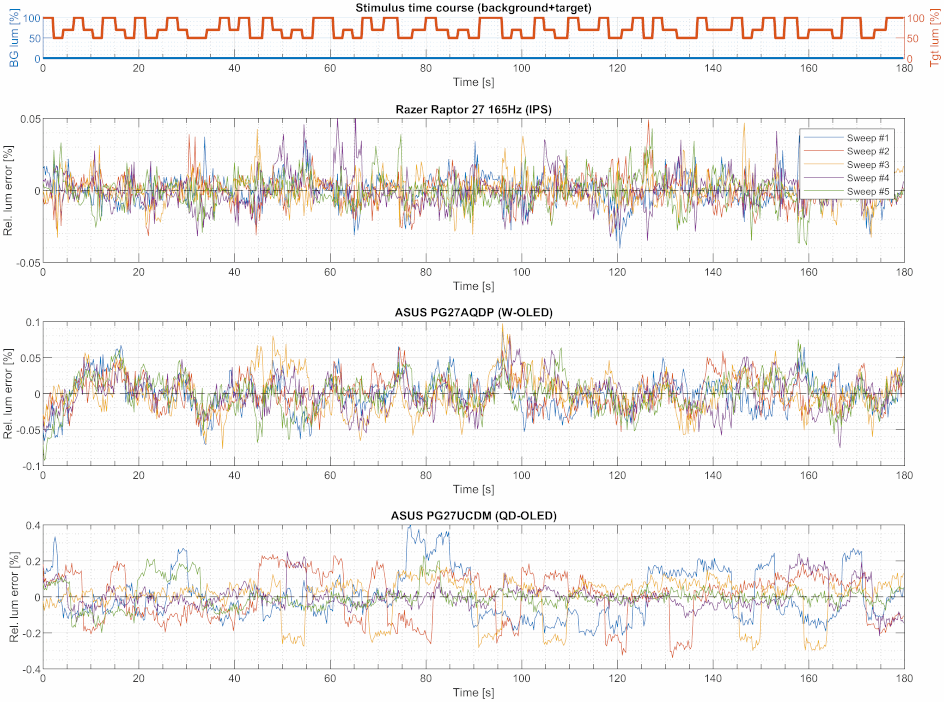
This is the same test as before but with the bigger target, for testing whether this would somehow stabilize the luminance of central area of the target. With the used photodiode, the measured area was not exactly confined to the area covered by the small target, but the measured area was still far smaller than the big target, as indicated by just a moderate increase of the photodiode signal of 30% (see section Measurement luminance method). If such stabilizing effect existed, it would result in smaller errors as compared to the equivalent small target test (Bg0+TgtVarSmall). On the other hand, a bigger target has a higher impact on the overall average luminance, which could have a potentially negative effect. Be it as it may, the net effect is basically zero for the ASUS W-OLED, while it is negative (i.e., big target is worse) for the ASUS QD-OLED monitor (see Figure 12 vs. ???, and Figure 3).












Conclusion
Given the small number of tested monitors , the findings presented here cannot be generalized. Also, pitting non-OLED monitors against OLED monitors seems unfair, because at least the key tests used here (variable background and ramping background) were specifically designed to tap into a problem mainly OLED monitors have: power control. Things would look obviously much different when testing for pixel-inversion or IPS glow. Nevertheless, the non-OLED data seemed interesting enough to be included here, and if it is only to show how much variability there is even between seemingly similar monitors like the two IPS monitors.
When just focusing on the OLED monitors and luminance stability, one could come to the conclusion that W-OLED is just the superior technology. But the sample size is just too small for making that claim, and the performance difference between the two QD-OLED monitors show how much implementation matters, let alone that it would be hard to explain why W-OLED should be better than QD-OLED with respect to luminance stability. Even claiming that OLED monitors in general have a luminance stability problem is more supported by the potentially good explanation (power control) than by the data presented here. Again, the small sample size is just too small.
It is difficult to evaluate the practical relevance of the presented findings, even when assuming that luminance stability is the only criterion that matters. For example, if predictability of luminance stability would be of most importance, then the TN monitor should be rated best, because it is performing at the same mediocre level throughout – very noisy even in the best-case scenario, but not so much affected by different image content either. Going by this rationale, the Razer IPS monitor should be rated pretty low, even though it performs better than all the other monitors in each single test; but it just exhibits rather high variability due to its exceptionally good result for the best case scenario.
Therefore, as so often, the final verdict depends on the application.