ASUS MG279Q: Difference between revisions
mNo edit summary |
(No difference)
|
Revision as of 08:07, 7 September 2022

Specifications
| Brand: | ASUS |
|---|---|
| Model: | MG279Q |
| Size: | 27" |
| Resolution: | 2560x1440 |
| Panel type: | AHVA (=IPS) |
| Max. refresh rate: | 144 Hz |
| Panel: | AUO M270DAN02.3 |
| Backlight type: | LED (white, edge) |
| Price (approx.): | USD 600 |
| Monitor release date: | 2015-06 |
| This review's date: | 2020-02 |
Reviews
ASUS MG279Q review on TFT CENTRAL.
At a glance
This monitor uses a 144 Hz IPS panel with a high pixel resolution of 109 ppi. It is advertised as a gaming monitor and is FreeSync-compatible. It also allows for a relative fine-grained adjustment of overdrive (or TraceFree, as ASUS calls it). The monitor does not, however, offer any motion blur reduction feature (aka strobed backlight). In general, IPS panels provide better colors over a wider range of viewing angles and higher contrast levels when compared to TN panels, but IPS panels are also slower than TN panels. This IPS panel comes with true 8bit resolution per color channel, which is rather common for IPS panels; however, the monitor does not offer support for true 10bit (per color channel) input signals.
One disadvantage of IPS panels is the so-called "IPS glow", a rather high background luminance appearing under more or less flat viewing angles. Unfortunately, the ASUS MG279Q exhibits plenty of IPS glow and is known for that, which kind of sabotages the potentially better colors this monitor might show in comparison to TN monitors – in comparison to older TN monitors, one should say, because TN monitors are catching up in this respect.
Even though it is still true that IPS panels are slower than TN panels, this does not necessarily hold for all or even the majority of pixel value transitions. When comparing monitor performance of the worst rather than the best cases, this IPS monitor performs even better than good TN monitors. It really depends on where to put the focus though when making such comparisons. Nevertheless, this monitor still leaves room for improvement, especially regarding short term settling performance, which would be important for motion blur reduction techniques to work well. So it is probably a wise decision not to offer such feature in the first place.
Good to know
IPS glow
As mentioned already, this monitor shows a pretty bad IPS glow. For example, the contrast in the lower left corner of the screen is as low as 78:1 (165:2.12 cd/m2) when measured at maximum brightness from a 60 cm distance and from the height level of the upper monitor rim (this is supposed to be an ergonomically good viewing position). Notice that also the absolute luminance level is rather low, given that the luminance at the screen center was at 375 cd/m2 with the very same monitor settings.
OSD and display modes
This monitor has a small joystick knob which makes it easy to go through the monitor settings – very convenient! The default display mode (not called display mode but "Game Visual" in the OSD) is "Racing Mode". Beside the "sRGB" mode, the "Racing Mode" appears to be the only mode in which bright levels are not crushed. "sRGB" is otherwise pretty useless though, because it does not allow any setting to be changed, not even the brightness. In "Racing Mode", all settings, except "Saturation" and "Skin Tone", are available. Moreover, "Racing Mode" is the only mode, beside the "Scenery" mode, which provides the full contrast, which is about 1240:1. In the "FPS" mode, for example, the contrast is just 685:1, which might have been reduced on purpose for providing more headroom for overdrive. Anyway, for this review we will stick to "Racing Mode".
Color channel crosstalk
When it comes to color accuracy, one potential problem is caused by interactions between the primary color channels (Red, Green, Blue). If everything was perfectly accurate, the luminances of the primary colors would add up like LW=LR+LG+LB(=LRGB for short). However, in case it is not so perfect, the (normalized) error Δe=(LRGB−LW) / LRGB is different from zero, and we can use this error as a (rather crude) measure for color channel interaction (see Figure 1). The ASUS MG279Q is obviously better in this regard than monitors with TN panels, which is kind of expected.
Color processing noise
Ideally, the monitor processes incoming pixel values so that the according output luminance follows a smooth transfer function. This processing usually takes place in the digital domain, while taking into account some targeted Gamma characteristic, the over-all Contrast setting, per-channel gain settings, and also spatio or spatio-temporal dithering. One way of quantifying how well this is done is to measure deviations from a smooth transfer function. Here, we do not focus on how well the transfer function is described by just a Gamma coefficient and a gain and/or contrast coefficient, but on how well the measured data points can be described by any reasonable smooth transfer function. We only measure the Green channel, because it is the brightest of the 3 color channels and, thus, provides the best S/N ratio. We set the Contrast and the Green gain to some values different from the factory settings in order to provoke potentially more internal calculations on the pixel values. The lowest and the most upper part of the pixel value range are not taken into account though, for several technical reasons related to the measurement method and data analysis.
Figure 2 shows the results for the ASUS MG279Q and, for comparison, the BenQ XL2540. Even though the BenQ has the edge in this comparison (SD=6.3% vs. SD=7.5%; smaller standard deviations are better), which is quite surprising, given that the BenQ XL2540 has only a 6bit+FRC TN panel and is capable of a much higher refresh frequency (240 Hz), the ASUS is still better than the BenQ XL2730Z (SD=9.7%, 8bit TN panel) or the ASUS VG248QE (SD=13.3%, 6bit+FRC TN panel).
When seeing these results, one might jump to the conclusion that we finally have come to the point where IPS and TN panels are on par color-wise. But one must not forget that these measurements do not capture effects of the viewing angles, and they do not capture interaction effects between color channels. Indeed, the Color channel crosstalk appears to be smaller for the ASUS MG279Q when compared to TN monitors, and color accuracy measurements (not shown here) indicate that the ASUS MG279Q has a larger gamut (99.69% sRGB vs. 96.8% for the BenQ XL2730Z) and an overall better color accuracy (dE2000=0.21 vs. dE2000=0.43 for the BenQ XL2730Z, on average over 400 colors).

Settling behavior
Unless otherwise noted, the measurements shown here were taken after having reset the monitor to its factory settings.
The measurements were made with a photo diode PDA36A (Thorlabs), the gain of which was set to 60 dB resulting in a bandwidth of 37.5 kHz and a minimal rise/fall time (10%-90%) of about 9 µs. The photodiode was placed at about 4.5 cm from the screen surface at a straight angle. Ambient light was kept from the measured area by a rubber lens hood of 3 cm diameter which also limited the maximal incident angle to about ±20°.
The vertical extent of the measured screen area was not only limited by the rubber sleeve but also by the stimulus being just a small horizontal stripe covering 5% of the screen height. Note that the LC cells are updated sequentially from the top of the screen to the bottom, which results in different delays for the luminance curves depending on the vertical measurement position. By limiting the measurement to only 5% of the full vertical screen size, the smear effect caused by averaging over differently delayed luminance signals becomes close to irrelevant. For example, at a refresh frequency of 120 Hz the screen is updated within around 8 ms, so if the true luminance would change instantly, the measured rise time would be 5%·8 ms = 0.4 ms, which is negligible here.
For more detailed information on the measurement method and the presentation of the results, see Flicker-free settling.
Settling curves
Figure 3 and Figure 4 show the luminance signals over time for the horizontal stripe being switched between gray levels 0%-100%, 25%-75%, and 45%-55% respectively. Note that these percent values refer to pixel values and not to luminance values, so the monitor's respective gamma transfer function has to be taken into account when interpreting these values in terms of absolute luminance.

The vertical gray lines mark the time when the OpenGL command sequence SwapBuffers();glFinish(); returns control to the PC program, which is about when the 1st line of a frame is sent out to the monitor. Measurements have been taken at the vertical center of the screen.
Figure 3 shows the luminance signal for different overdrive levels (TraceFree). The overdrive setting does not have any effect on the full luminance range transitions (blue curves in the figures), indicating that, with the used contrast setting of C=80%, the monitor is hitting the saturation boundary already, thereby leaving no headroom for overdrive. Figure 4, although showing data for 144 Hz, nicely illustrates the effect of providing more headroom for overdrive by lowering the contrast. If there is an overdrive effect on the maximum luminance step at all, this overdrive effect appears to be way more pronounced for the transition from dark to bright than for the opposite transition. This asymmetry is noteworthy insofar as it appears to be very similar to the asymmetry observed in TN panels (see, for example, the luminance signals for the ASUS VG248QE), even though TN panels are normally-white panels (usually, as for the panel in the ASUS VG248QE), whereas IPS panels are normally-black (usually, as for the panel in the ASUS MG279Q reviewed here). However, due to reasons explained in LCD dynamics, one could have expected the direction of the asymmetries to be different for TN and IPS panels, which is clearly not the case. On the other hand, finding such similar overdrive asymmetries for different panel types supports the speculation made in LCD dynamics, namely that overdrive is achieved by sacrificing contrast rather than by using beyond-saturation voltages, in which case it does not matter whether the panel is normally-black or normally-white.
The IPS panel used in the ASUS MG279Q exhibits a natural luminance settling ("natural" meaning "when used without overdrive"), which is faster for dark-to-bright transitions and way slower for bright-to-dark transitions, when compared to, for example, the TN panel used in the BenQ XL2730Z. This is unfortunate insofar as settling errors might appear more pronounced in the dark than in the bright; notice that the y-axes in the figures are linear luminance axes.
Another difference to TN panels is the much smaller luminance "pumping" effect, especially when luminance undergoes a full-scale transitions from dark to bright (blue curves), whereas, in TN panels, the luminance curves seem to need several pushes in order to make it all the way up. This suggests that IPS panels might not benefit from higher refresh rates as much as TN panels do when it comes to reducing the settling time.
Comparing the settling behavior between refresh rates (120 Hz vs. 144 Hz) at otherwise identical settings (C=80, Tf=80; lower right plot in Figure 3 vs. left plot in Figure 4) reveals that the TraceFree setting does not scale well with the refresh rate, i.e. a TraceFree setting that works well for one refresh rate might be sub-optimal for the other refresh rate.
Settling matrix measurements
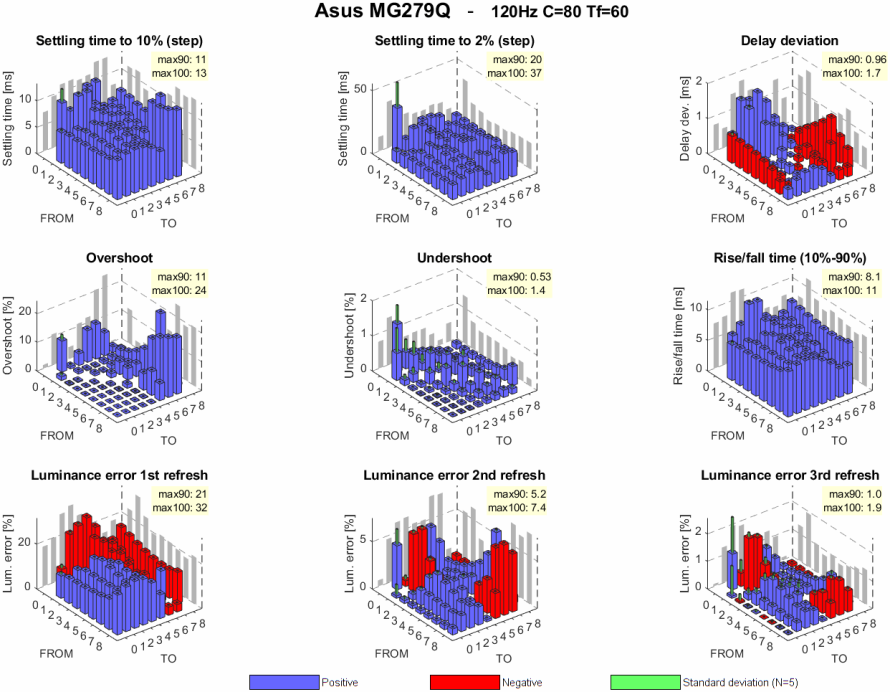
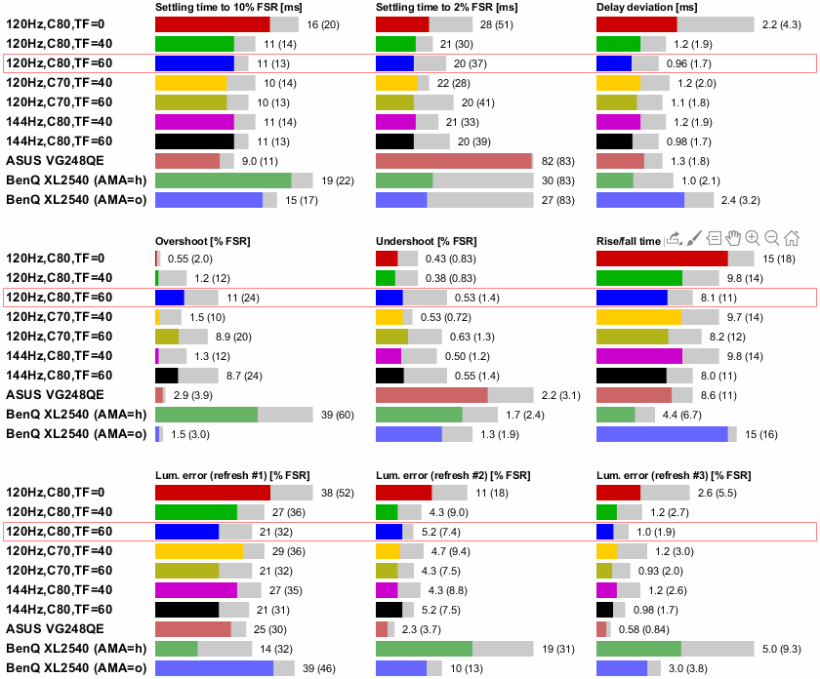
Figure 5 shows a few characteristics of the pixel luminance settling when systematically switching the pixels between a set of FROM and TO values. For more information on the used methods and the data presentation, see Flicker-free settling. In comparison to TN monitors, the ASUS MG279Q with its IPS panel shows less variation within the measurement matrix for a given characteristic, with the worst FROM-TO steps often being even better than the worst FROM-TO steps found in TN monitors (see also Figure 6). Moreover, even if a TN monitor might show faster short-term settling, the ASUS MG279Q has the edge when it comes to long-term settling, as can be seen from the 2% settling times and the luminance errors for the second and third refresh frames.

For further details on the graphs and the measurement method see Flicker-free settling.

The supposedly best case, which is also shown in the matrix plots above, is framed in red.
The results for the ASUS VG248QE and the BenQ XL2540, both having TN panels and being measured at 120 Hz, are just provided for comparison.


